For the sake of being objective I decided to let the dust settle a little on what turned out to be Notts County's third defeat in a row and Ian Burchnall's 4th league defeat in 6 since taking over the reins as head coach.
Whilst doing so it emerged that in an alternate universe the richest clubs in world football thought it would be a jolly good idea to set up their own non competitive money spinning boy's club, something so far removed from the origins and ethos of the game it beggars belief.
Thankfully the unified wave of distain for the project within the football community was enough to stifle any momentum the crack pot scheme may have had, royally embarrassing some of the main protagonists along the way.
Anyway, we've got bigger fish to fry, starting with a promotion winning play off charge to the end of this season, so with that in mind let's get straight down to it with the stats from Saturday's defeat where Notts provided the target practice for the Spitfires of Eastleigh . . .
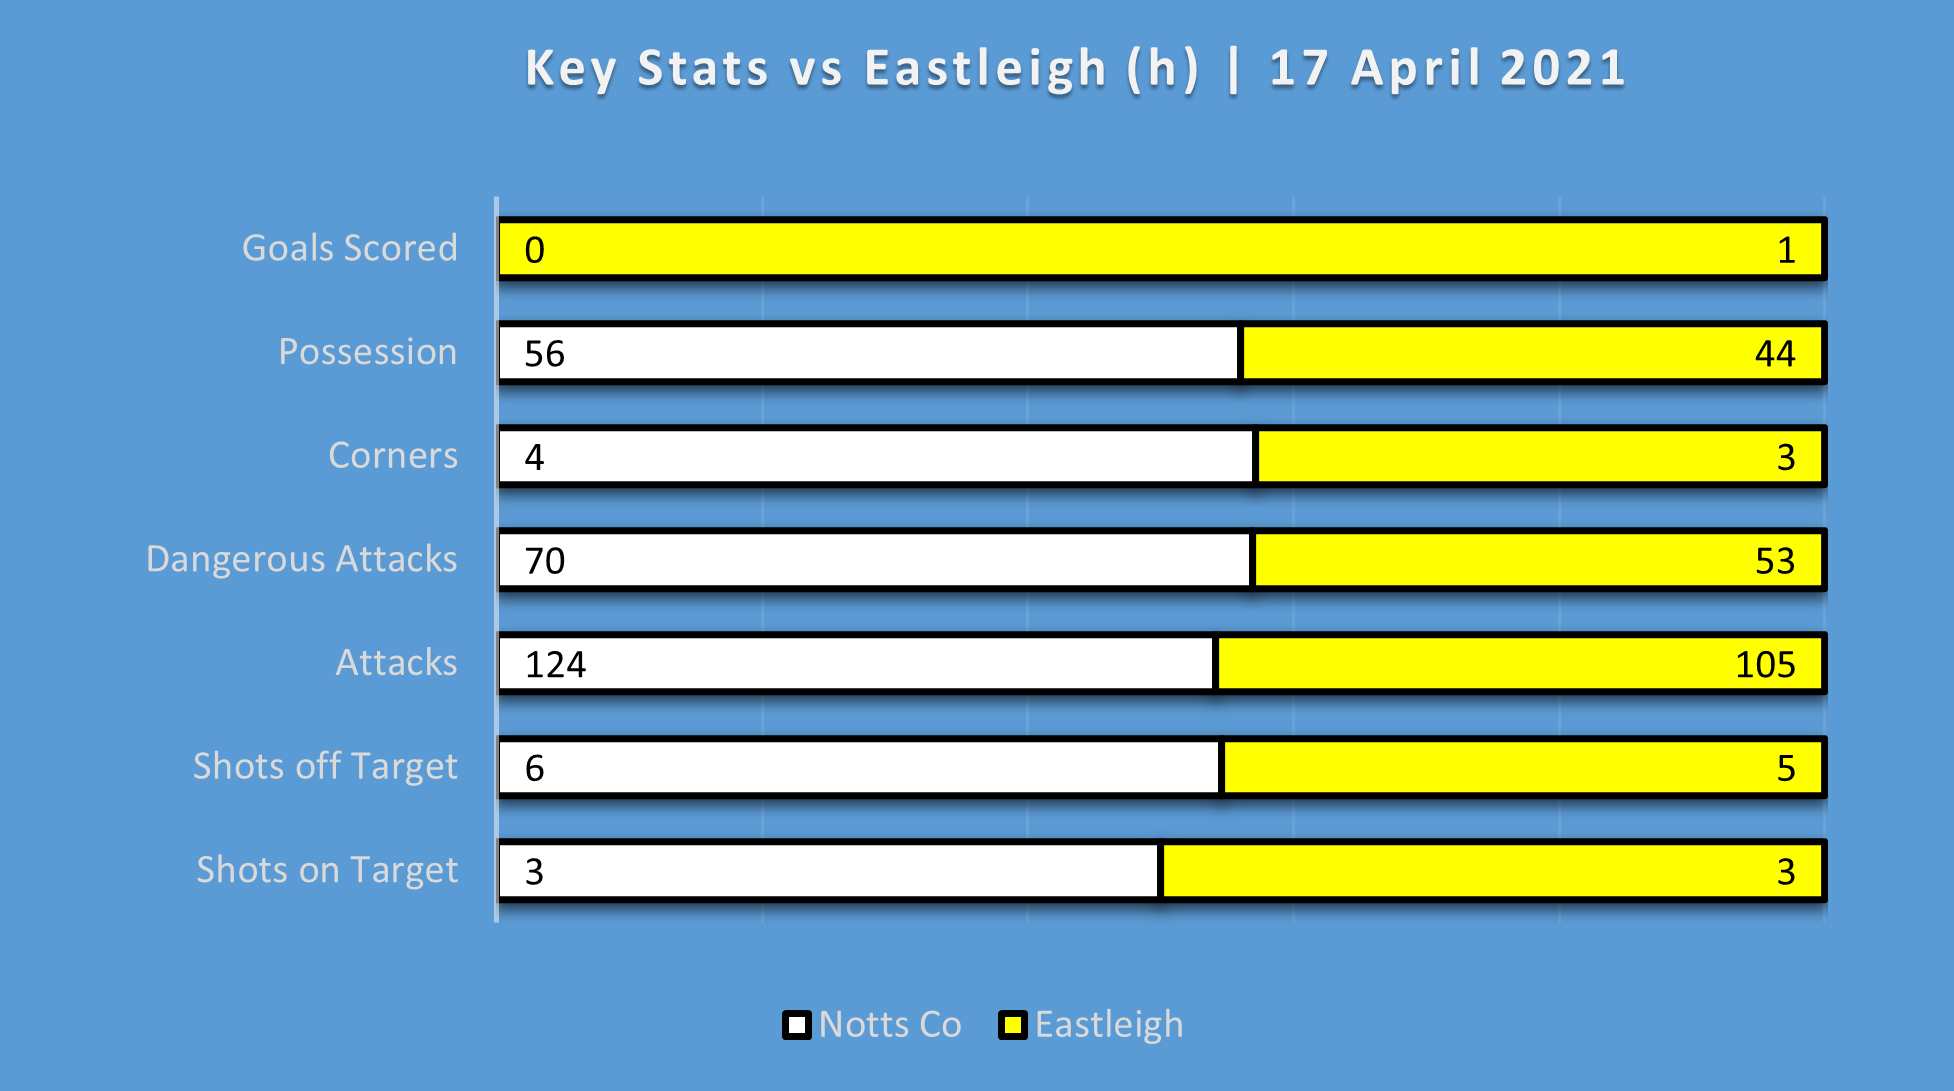
Match stats below and not much to separate the teams at first glance, except the goal of course.
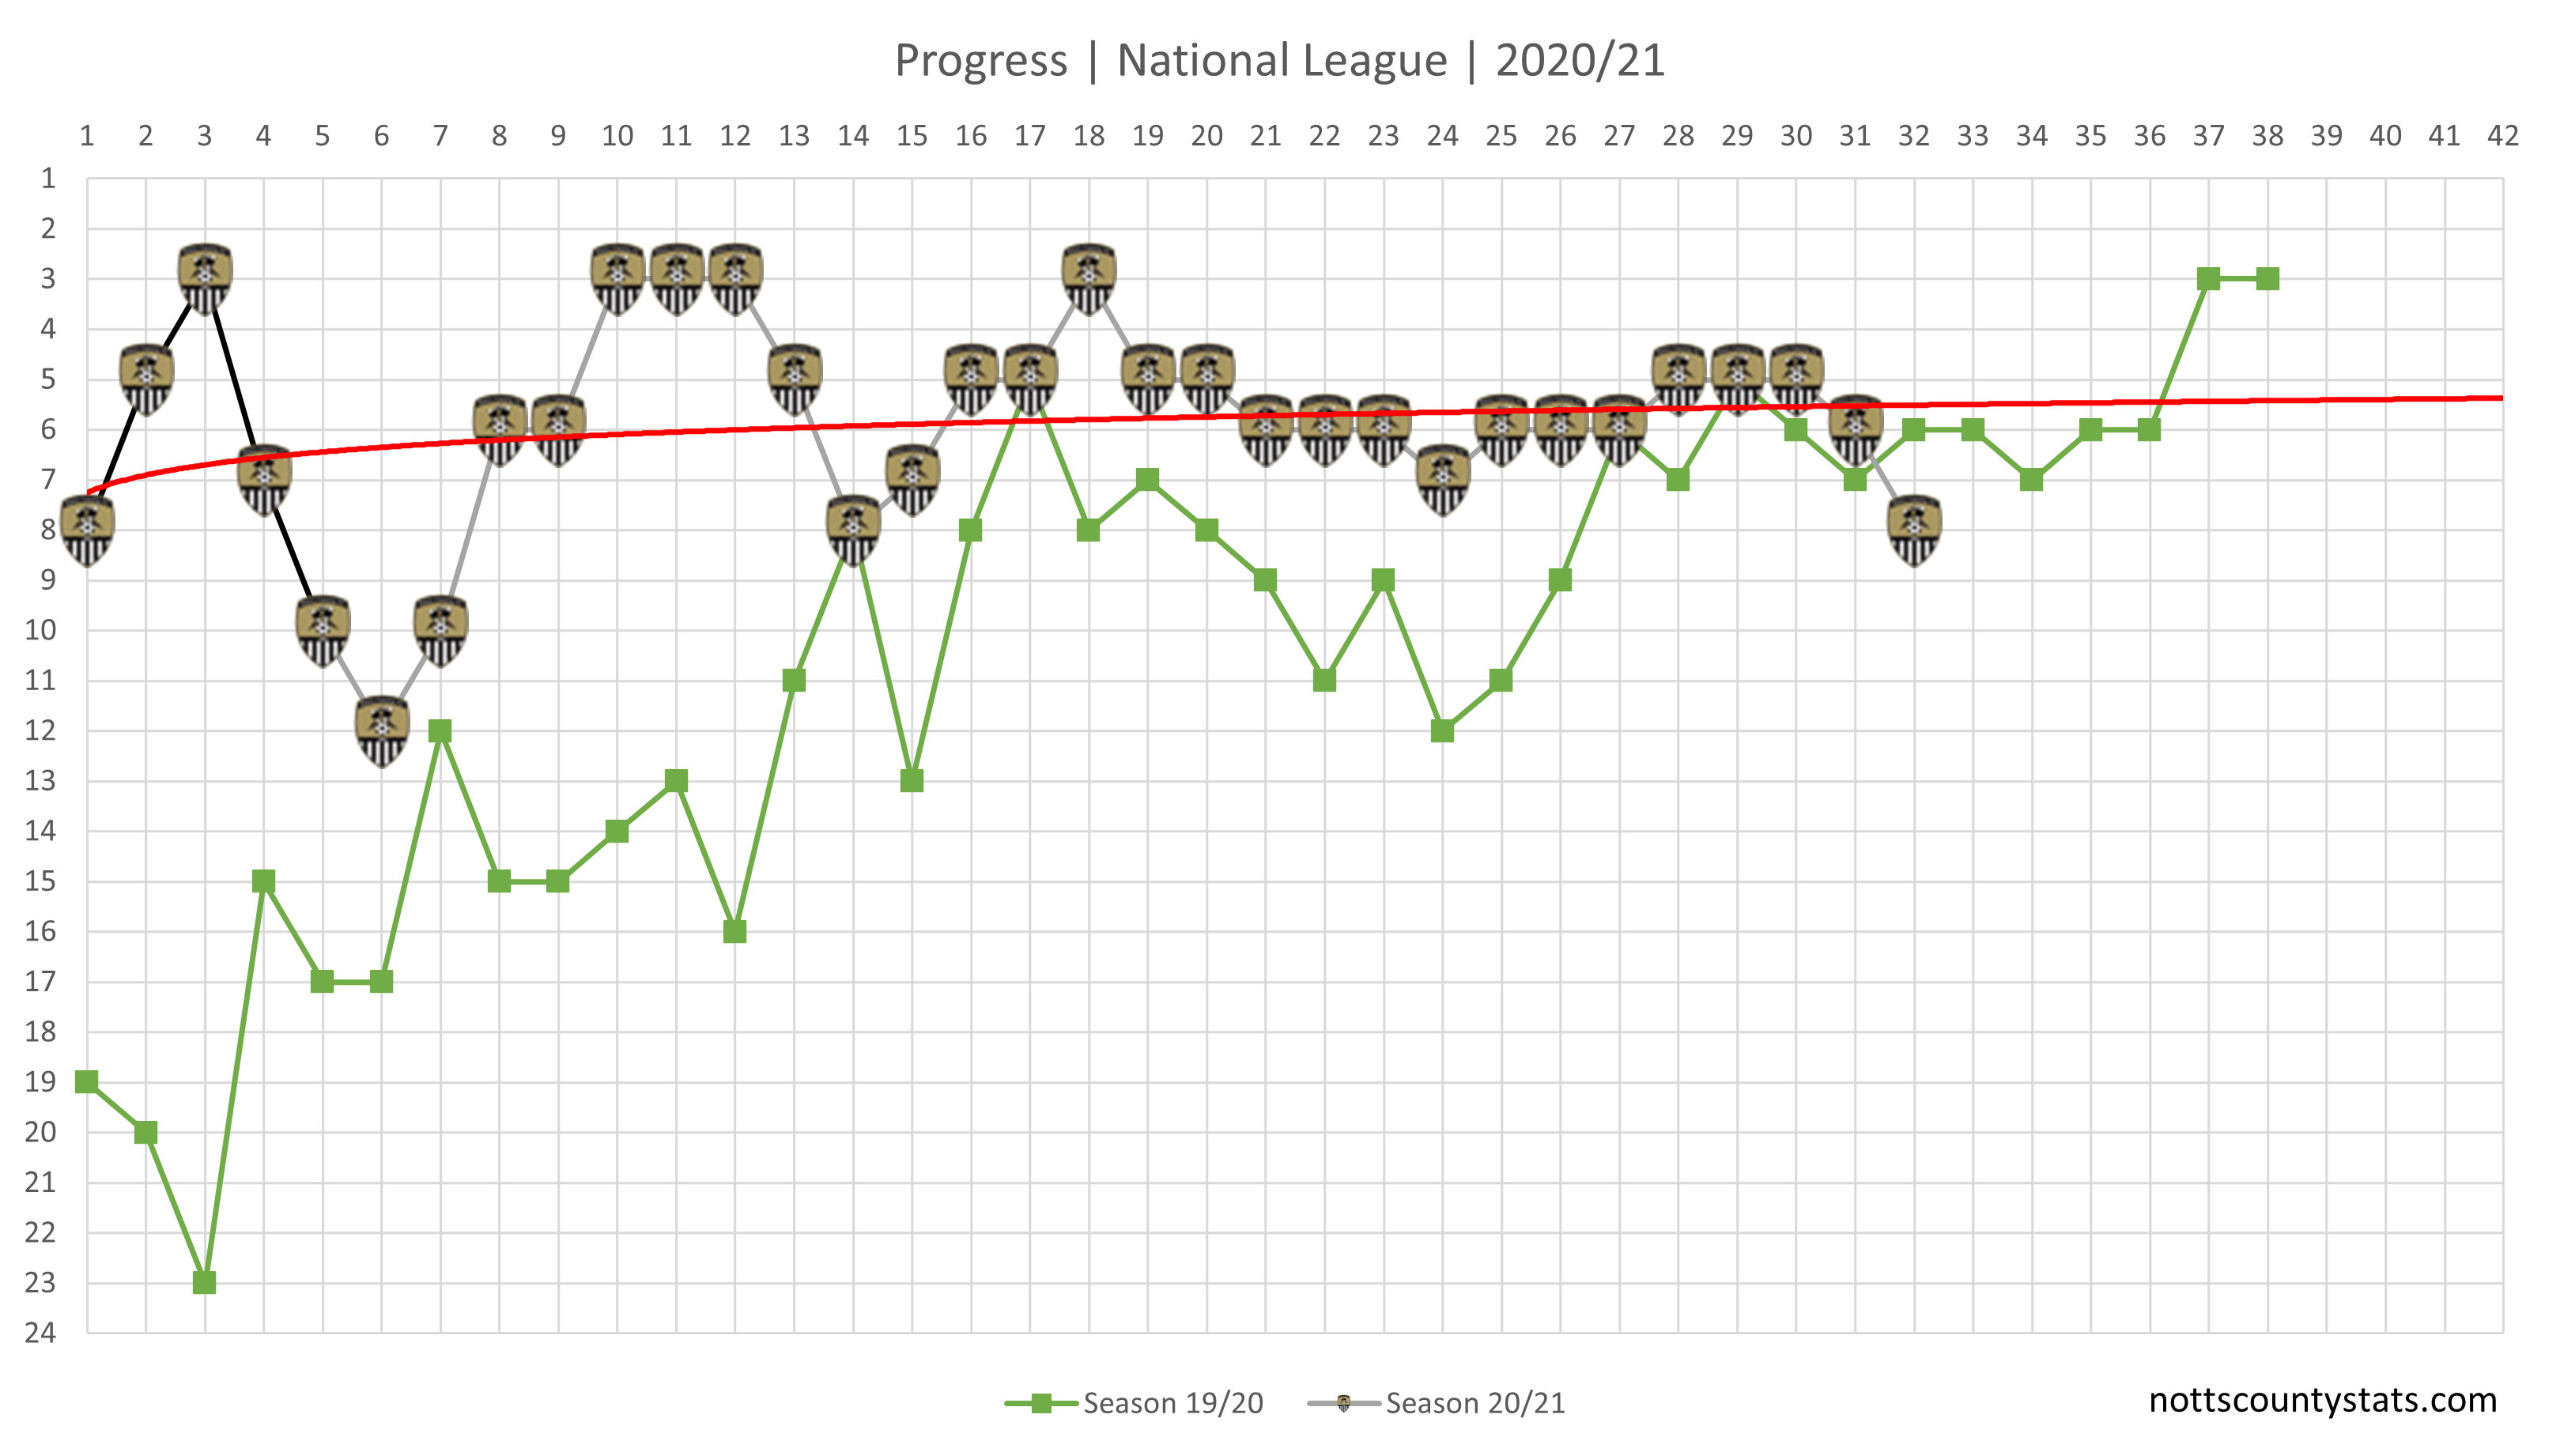
Progress updated.
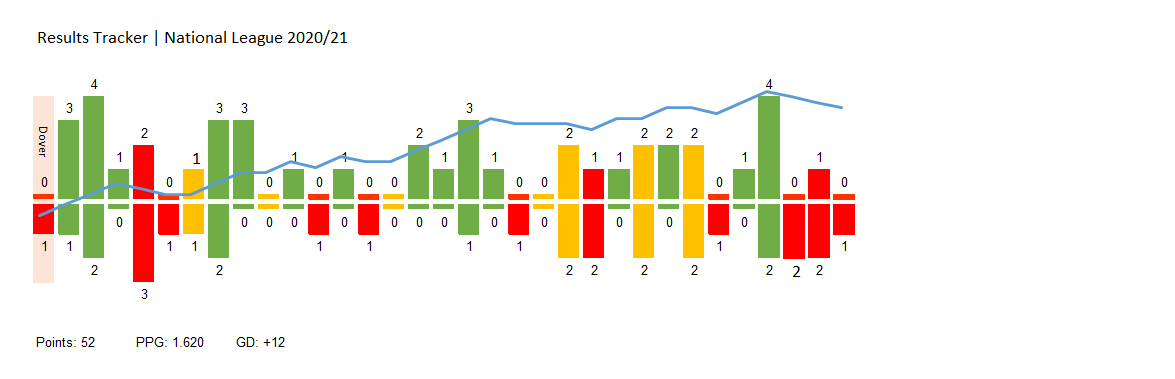
Results tracker updated now with a line that provides another visualisation for progress throughout the season based on 'win' = 2, 'draw' = 1 and 'loss' = -1.
Points needed now with adjusted targets to represent predicted points totals for the current season. Following the Eastleigh defeat Notts are still projected to finish in a play-off place, but only just. You can filter the chart by clicking on the legends at the top.
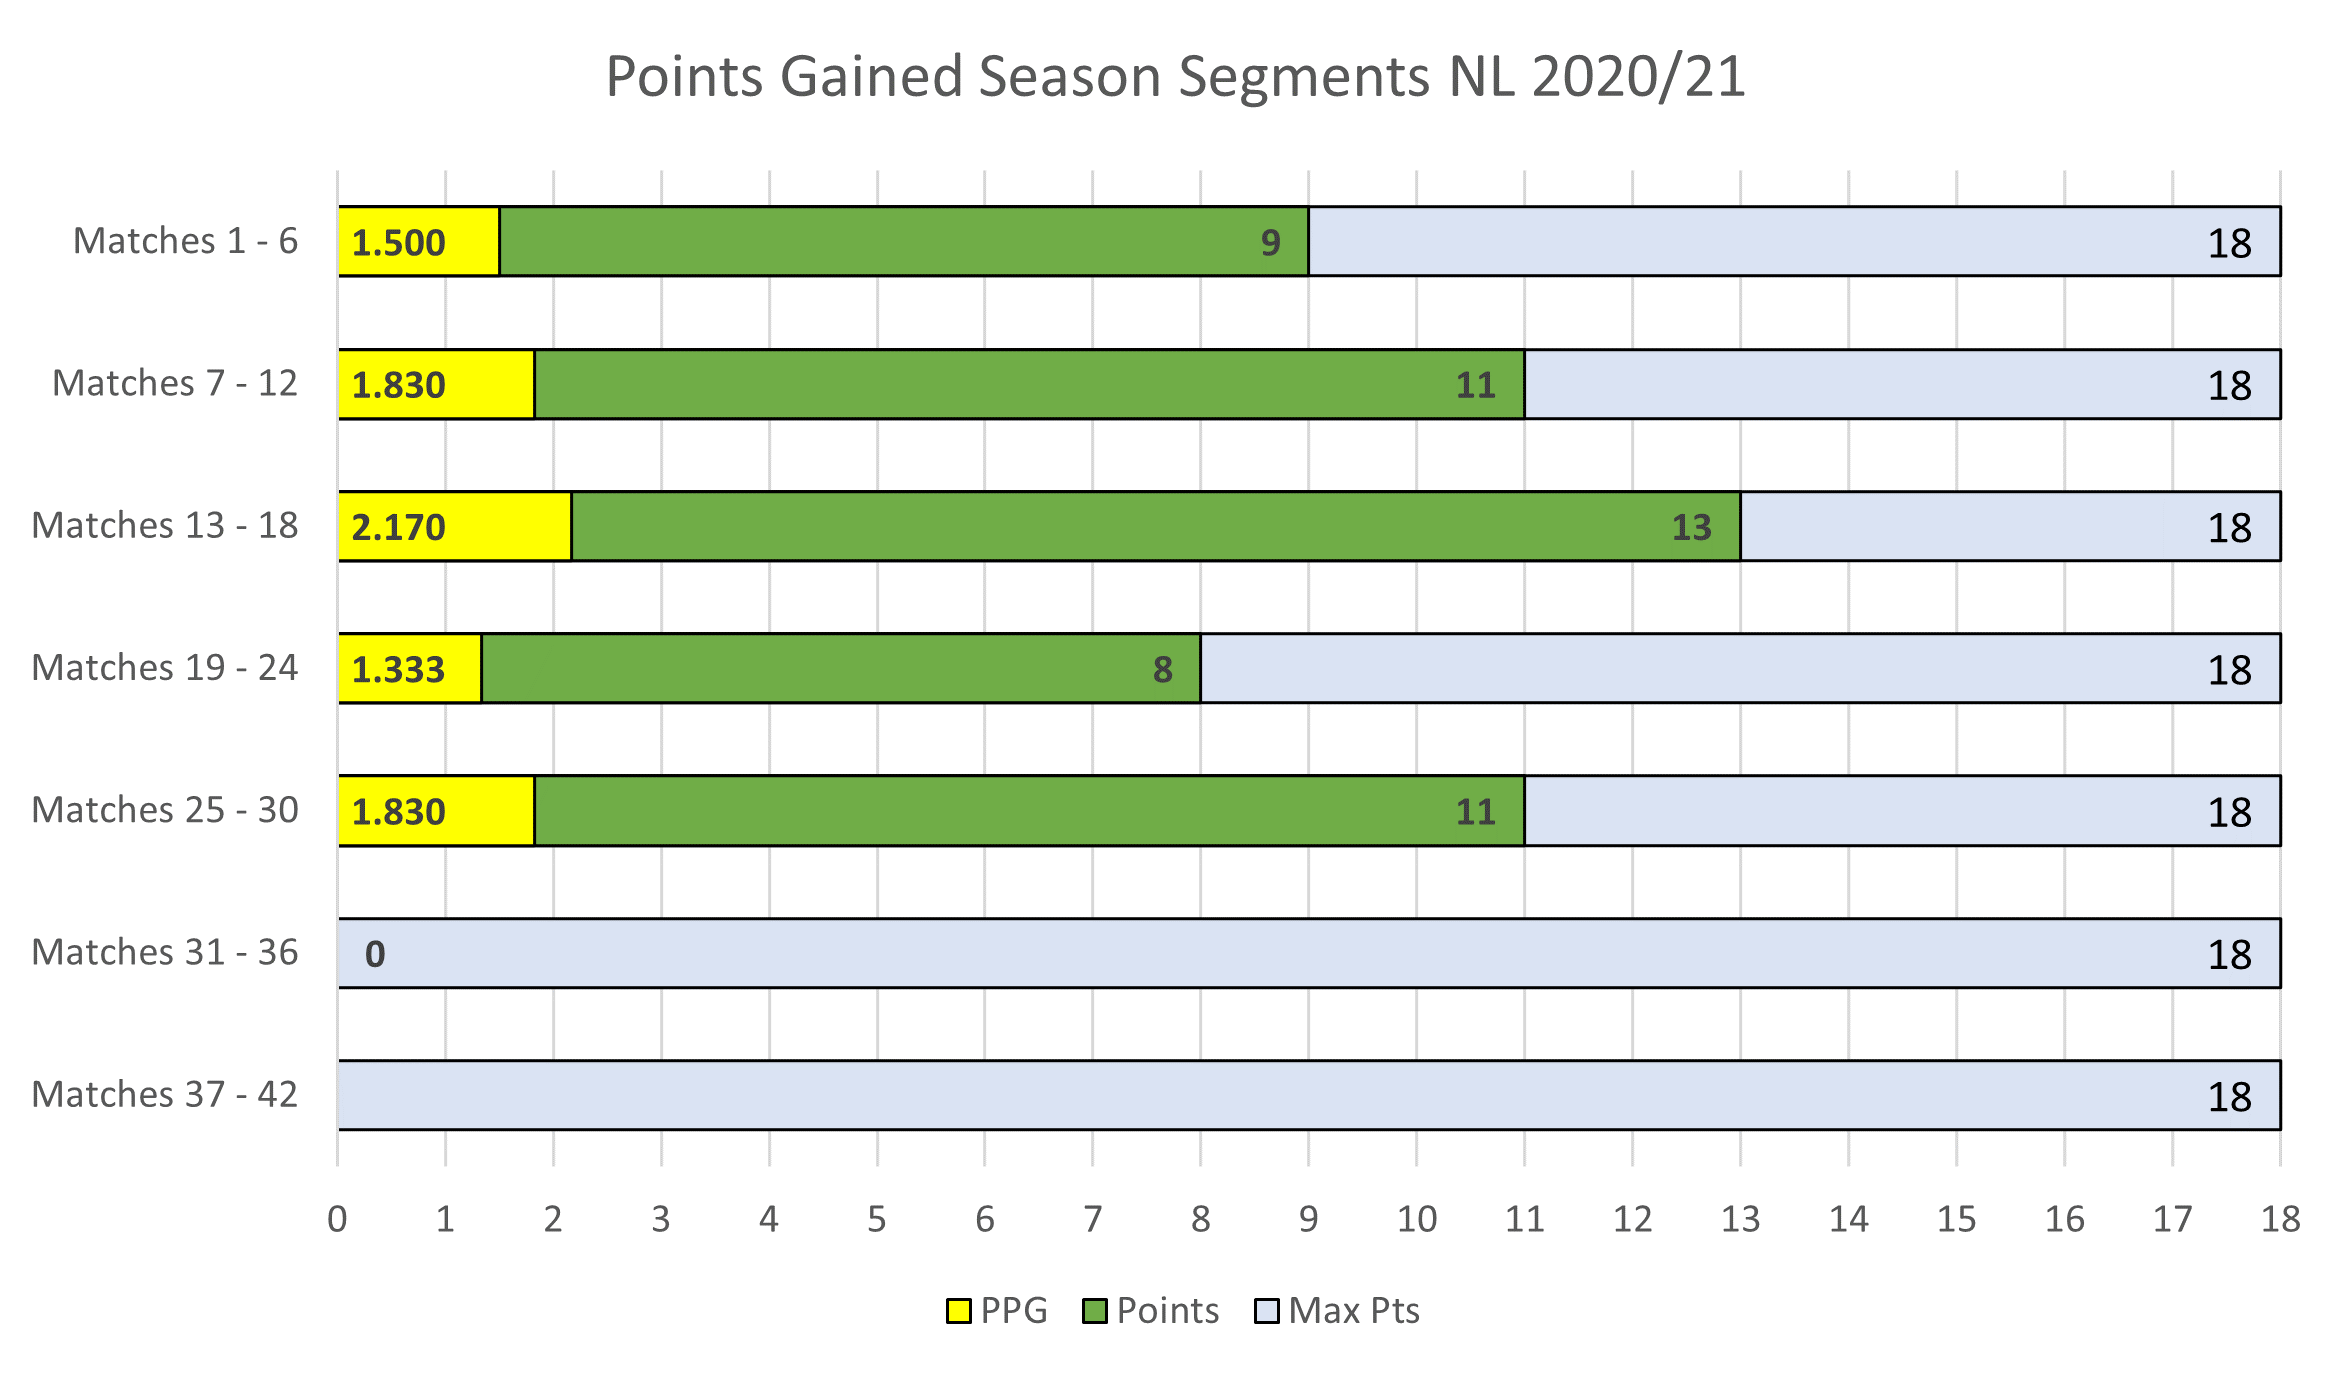
League segment chart updated. Grey bar shows total points available for that segment. Green bar shows total points gained and yellow bar the PPG for that segment.
The defeat at Dover is still included in this visual (matches 1-6). No points yet for the first three games in this 6 game segment.
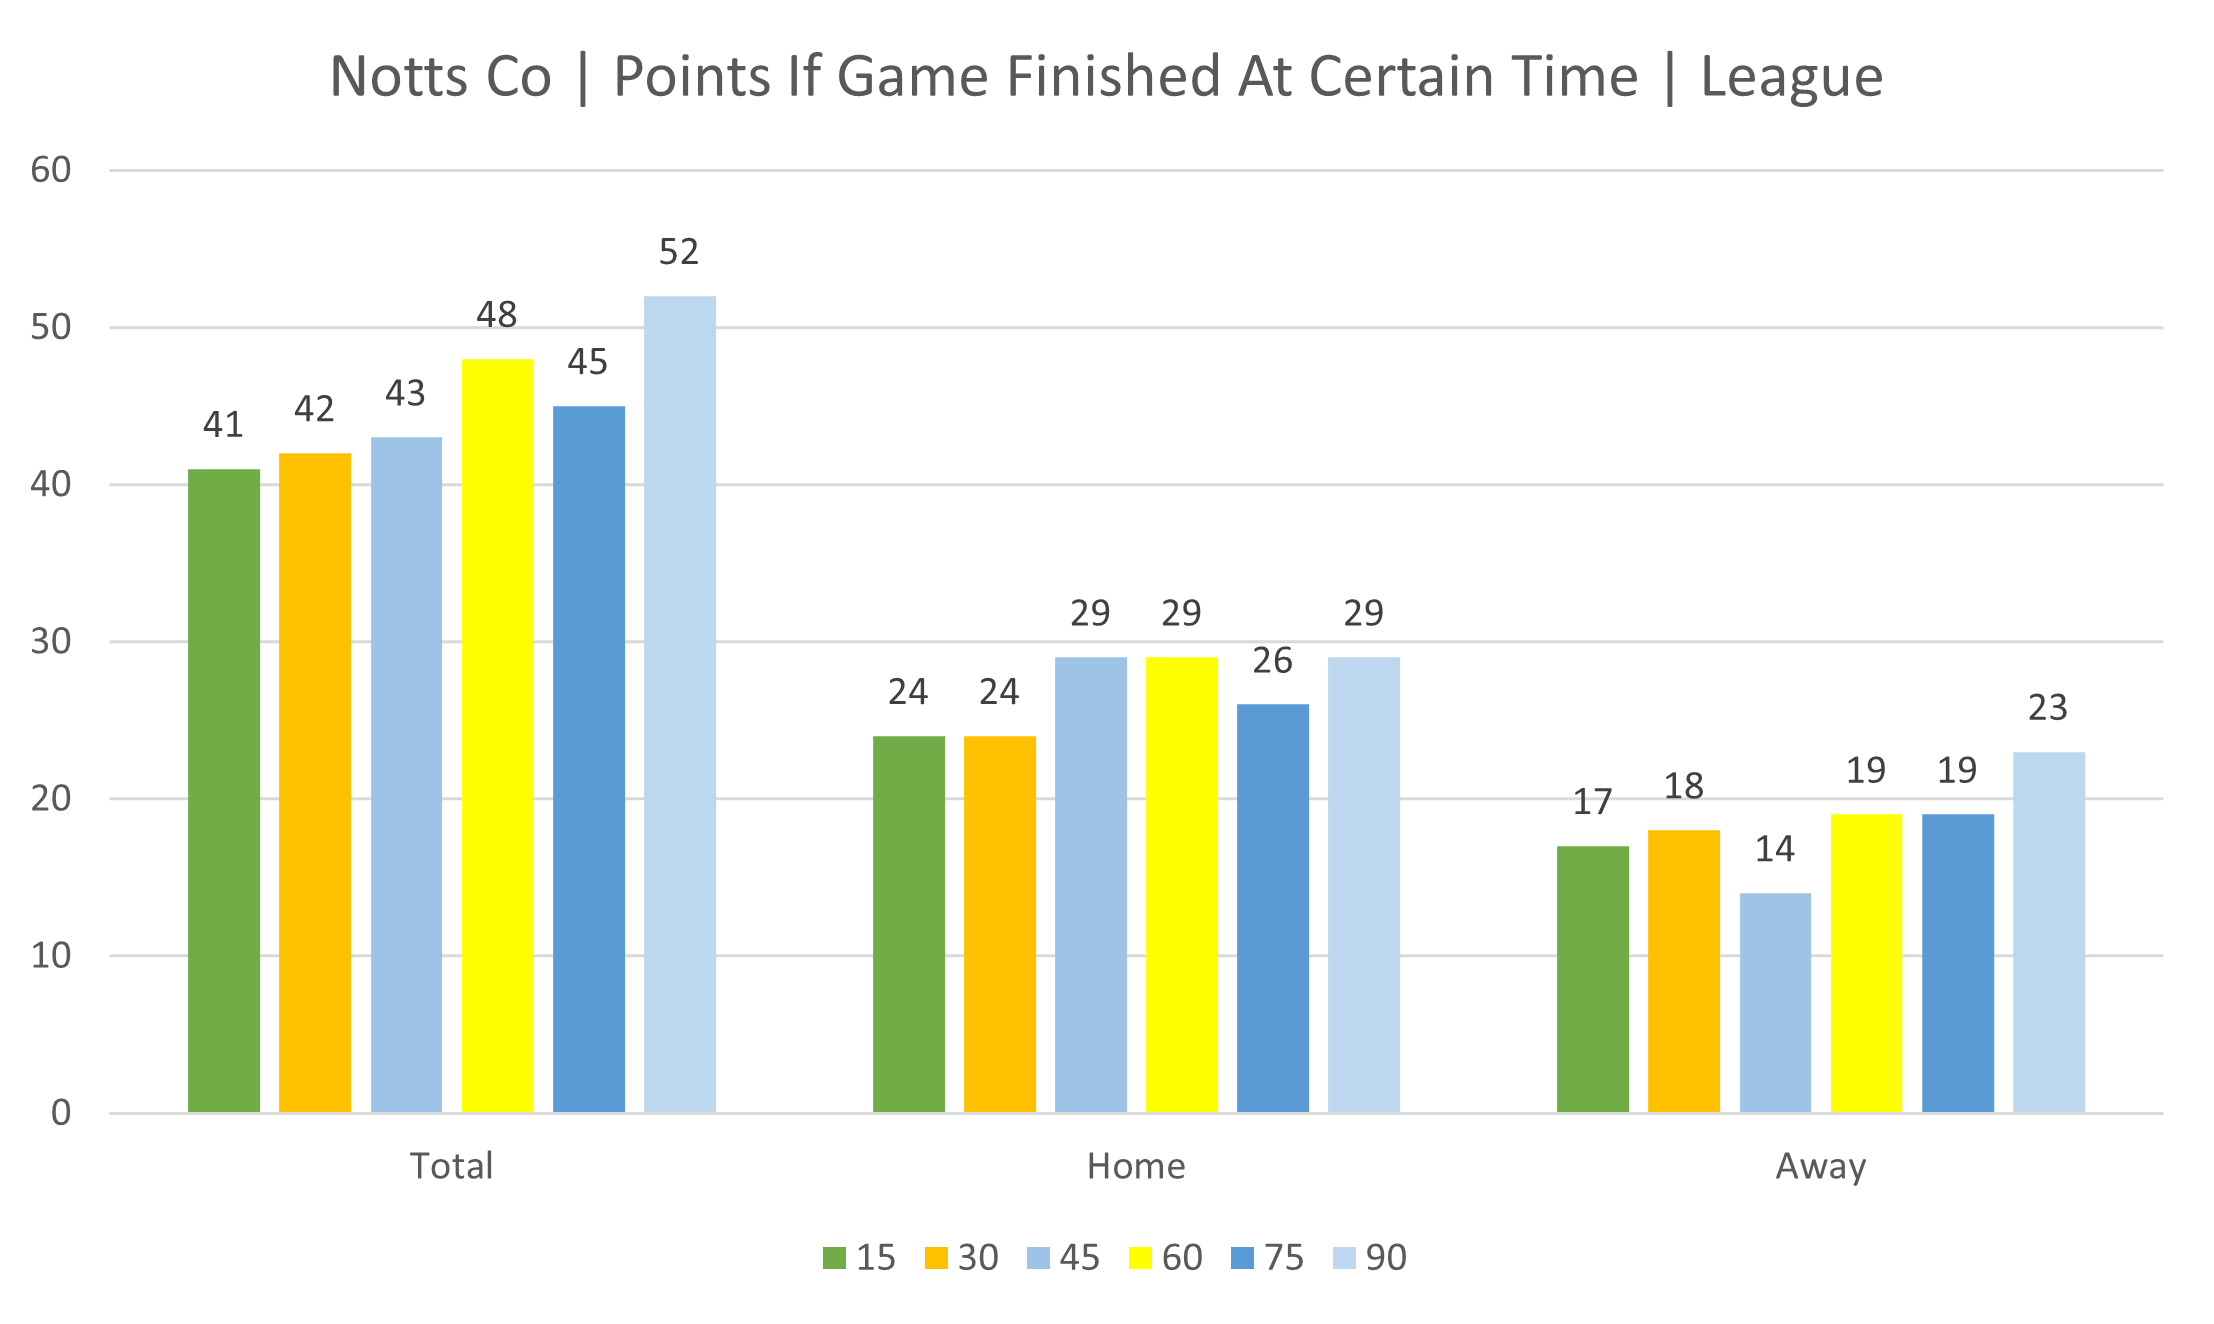
Points by time segment. How many points would have been accumulated if games had finished at 15, 30, 45, 60, 75 and 90 minutes.
It's interesting to see a similar trend for both home and away matches.
Onto player stats now and remember you can use the search function to see individual players or click on a column heading to sort highest to lowest etc.
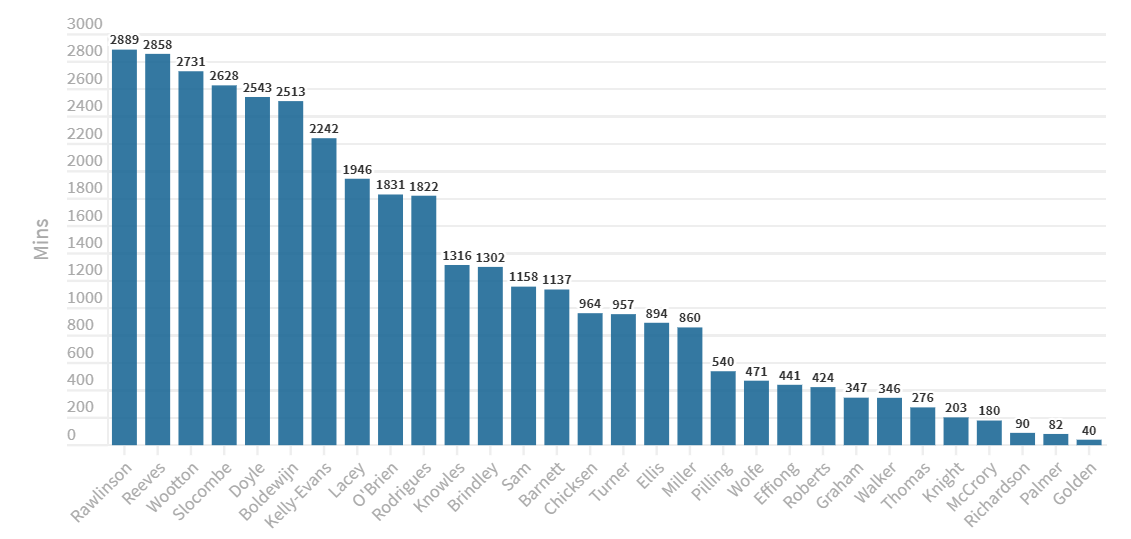
Minutes played updated:
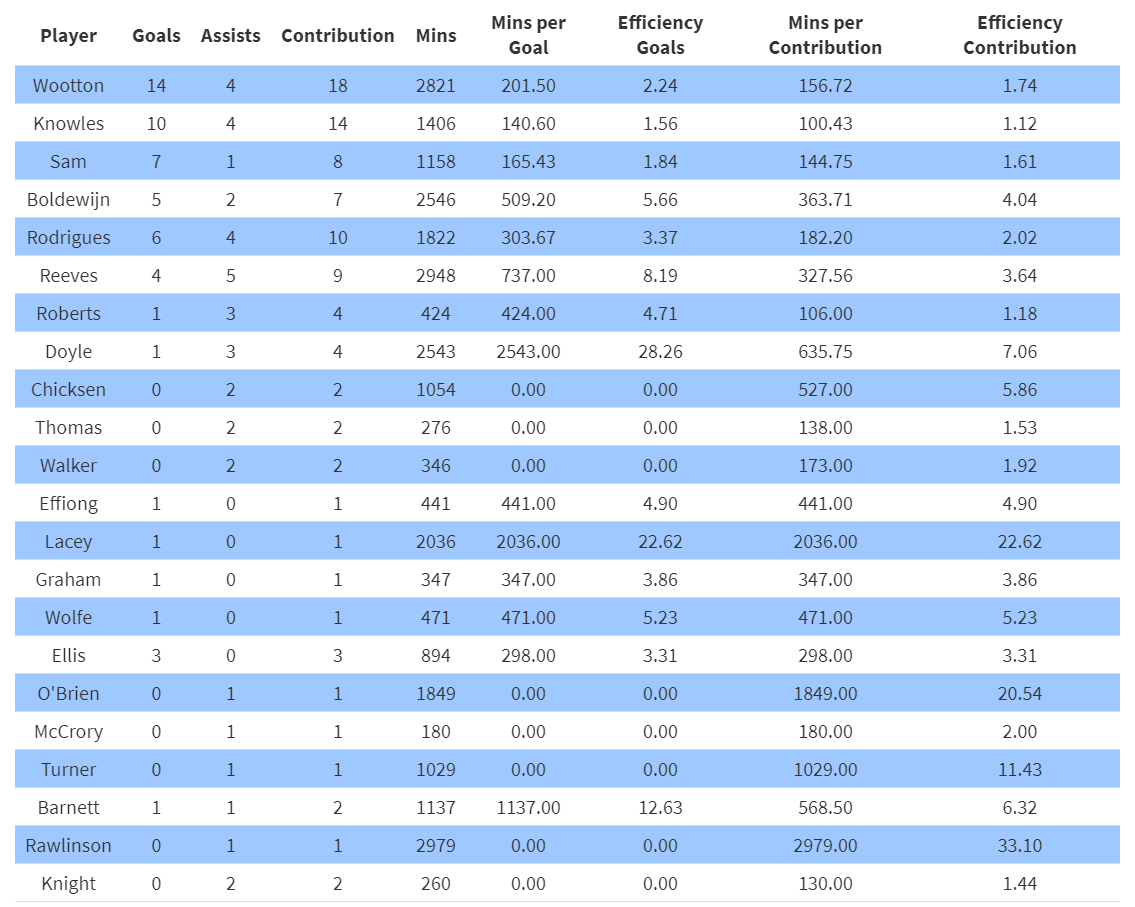
Goal contribution table updated. Again, you can find this on the website and sort columns etc.
Goal participation by minute detailing player goal contribution efficiency.
Goals scatter chart updated. Starting to see a few more dots outside the box.
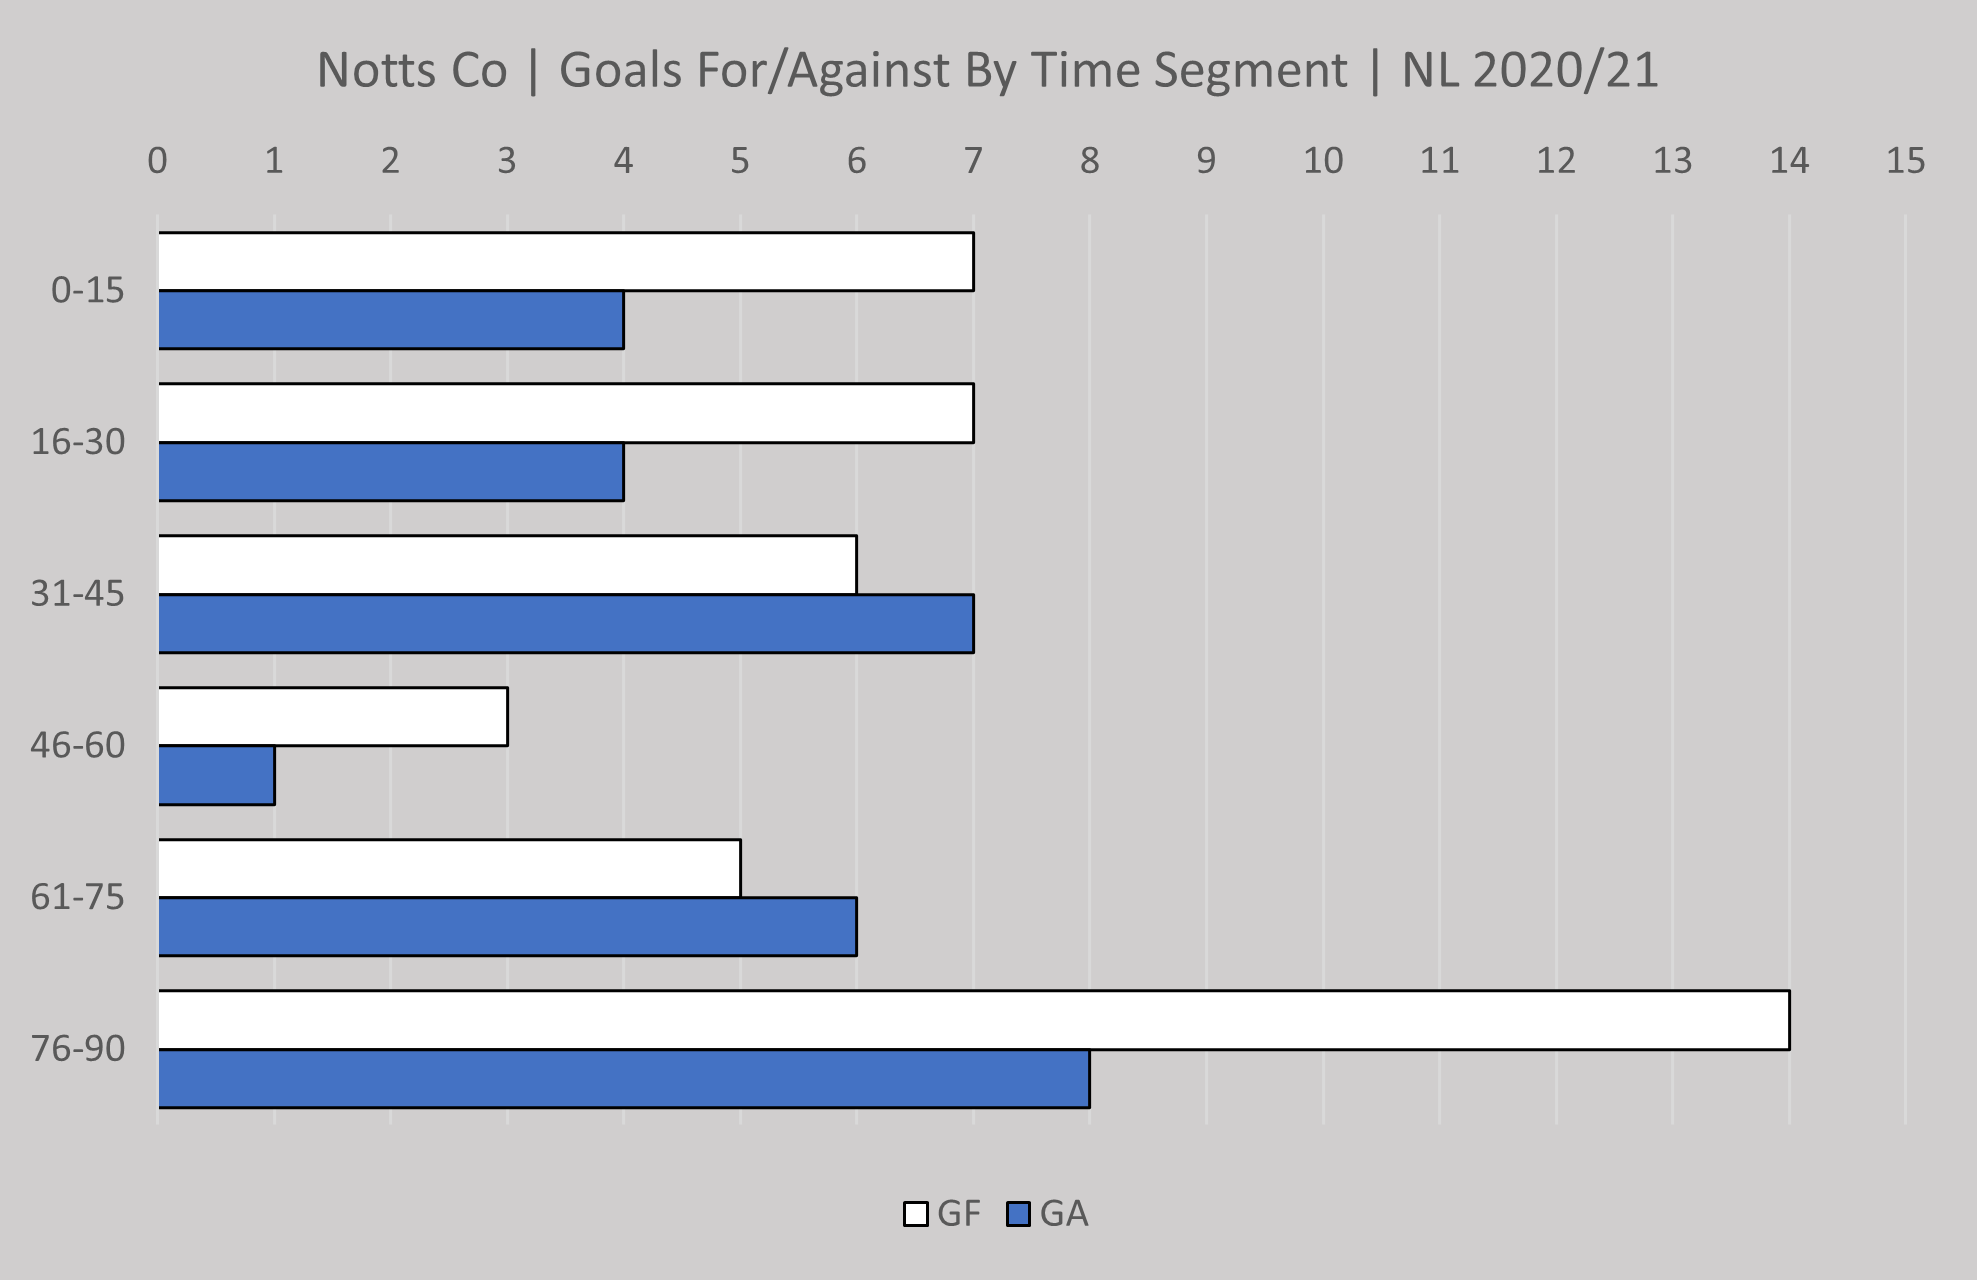
Goals by time segment updated.
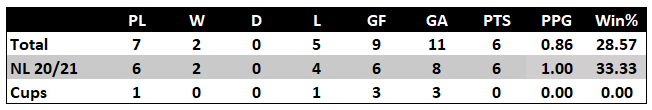
Ian Burchnall's record updated and it's just 2 wins from 7 games so far.
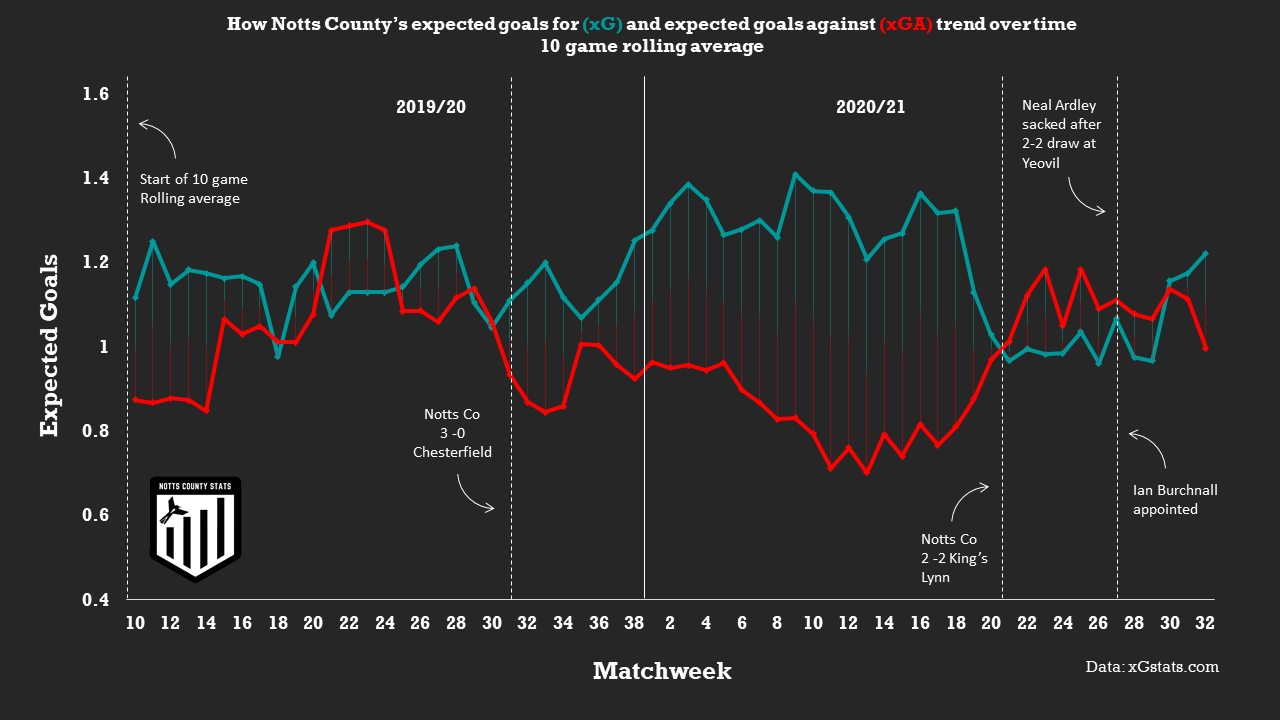
There has been a problem obtaining the xG data from my provider this week for the Eastleigh go so instead I thought I would share a couple of visualisations I've been working on this week that casts a closer analytical eye on Notts' time in the National League to date.
This first visual charts a 10 game rolling average for expected goals (xG) and expected goals against (xGA).
What we can see from this visual is the erratic nature of last seasons campaign which was very much up and down up until the 3-0 win at home to Chesterfield which was played out in front of the BT Sport cameras.
After this win xG continued on a similar trajectory and xGA started to drop slightly suggesting that despite not creating many more chances Notts were more in control of games, making good use of chances created and reducing the number of chances for the opposition.
As we move into this season the gap between xG and xGA widens quite dramatically but mainly because Notts had a sustained spell where they restricted the opposition to few chances which in turn saw them top of the defence league for a large part of the season.
This trend is relatively stable up until the 2-2 draw at home to King's Lynn which saw the xG drop lower than xGA for the first time since the middle of last season.
This is where things appear to have gone a little pear shaped for Neal Ardley with a string of 6 games which saw just 2 victories against Wealdstone away 1-0 and the 2-0 win at home to Yeovil.
Despite just 2 wins in his first 6 games in charge Ian Burchnall does look to have put right that trend (for now) with xG back above xGA in the three games up to and including the defeat away at Solihull.
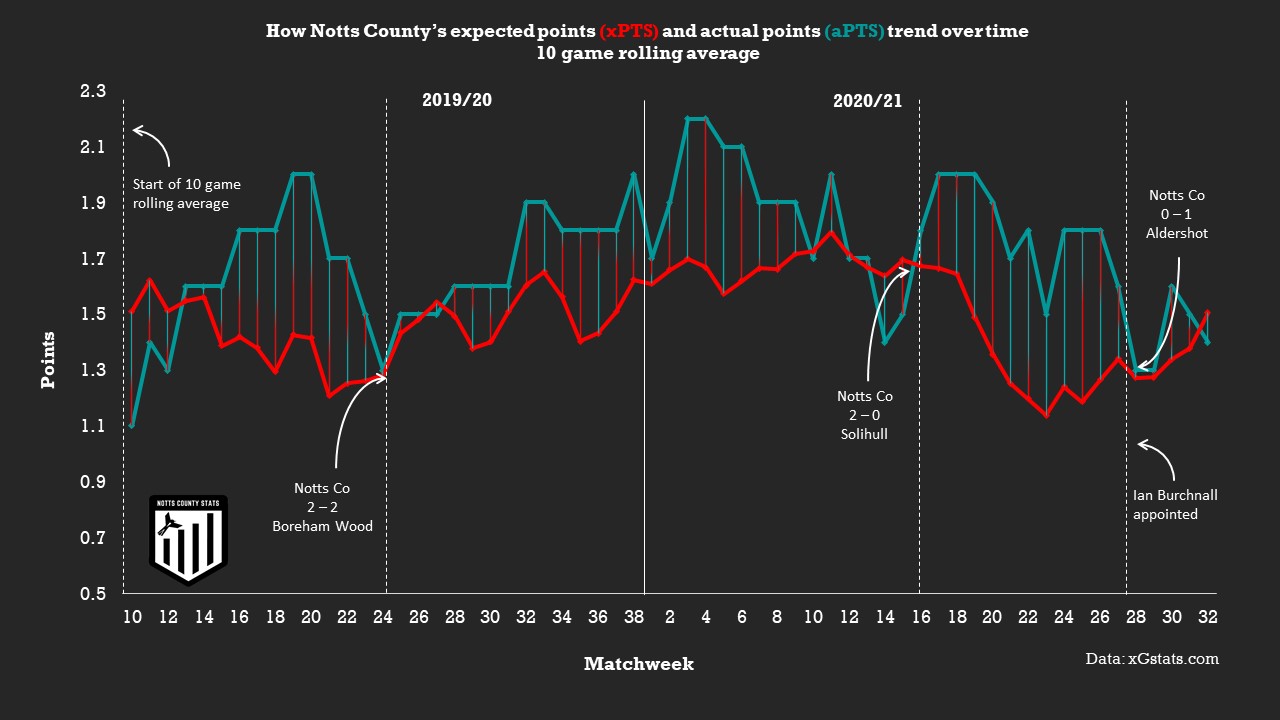
The next visual provides the same outlook but this time using expected points (xPTS) vs actual points (aPTS).
There is a common theme throughout both seasons of Notts gaining more points than expected.
There is a string of half a dozen games during the middle sector of this season where Neal Ardley seems to have bucked the trend where expected points were finally in line with actual points but normal service resumed after the Solihull win at home.
The importance of tracking xPTS compared to aPTS is that it helps to identify how a team have been performing and whether they did or didn't deserve the results achieved.
There is an argument that suggests if you're playing badly and still getting results then that's fine. However when analysing this you have to ask if that form continues, just how sustainable is it?
For Notts this would suggest the positive results were not necessarily deserved and it was likely a bad run was always just around the corner.
Unfortunately this became the case for Notts after that win at home to Solihull where both xPTS and aPTS started to nose dive culminating in the departure of Neal Ardley.
Again despite the early defeats for Ian Burchnall it's clear Notts are back on an upward trajectory of sorts and if they can find the defensive form of earlier in the season the more attacking approach might just offer a glimmer of hope of a play off promotion. Mind you, as we all now know, it's the hope that hurts you!
Preview | Torquay Utd (a) | Vanarama National League | 15:00
Saturday 24th April 2021 | Plainmoor
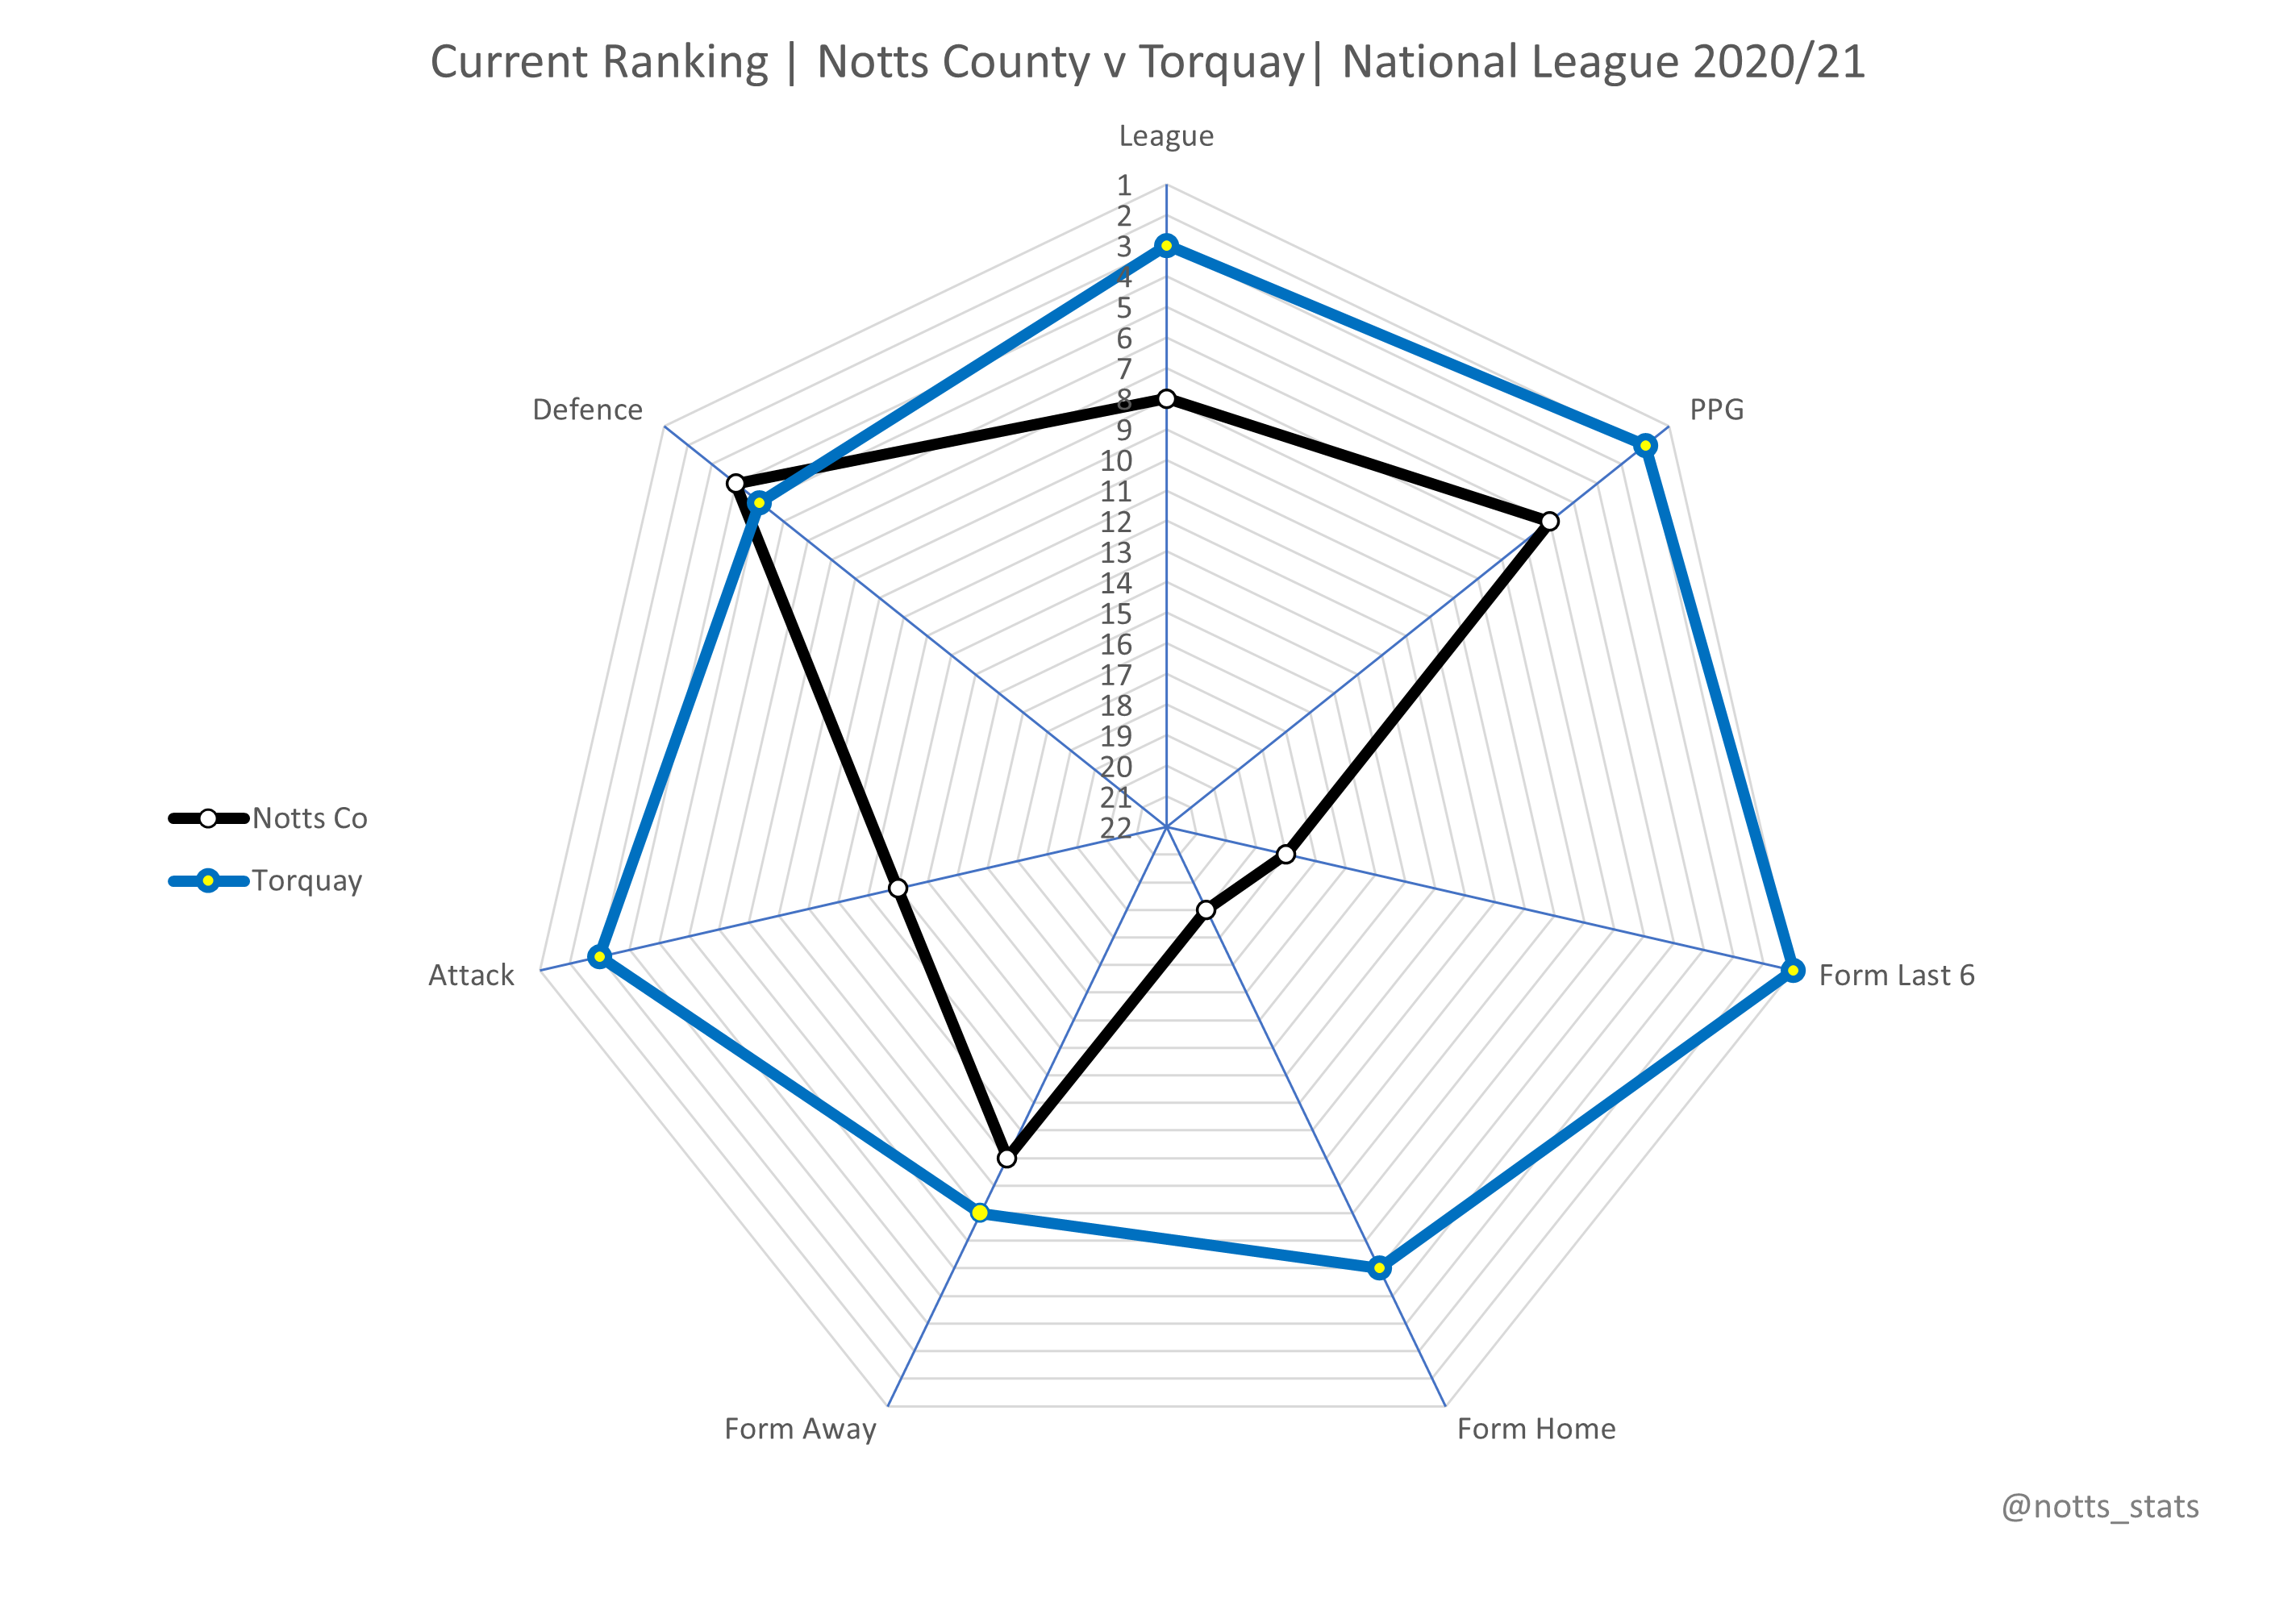
Notts travel south to the English Riviera on Saturday to face a resurgent Torquay United who find themselves back on top of the form tables and back in the title hunt having won their last 5 games in the league.
Meanwhile the Magpies are staring down the barrel of 4 consecutive defeats and losing a grip on what up until recently looked like a guaranteed play off spot.
Recent form radar and it's all Torquay really.
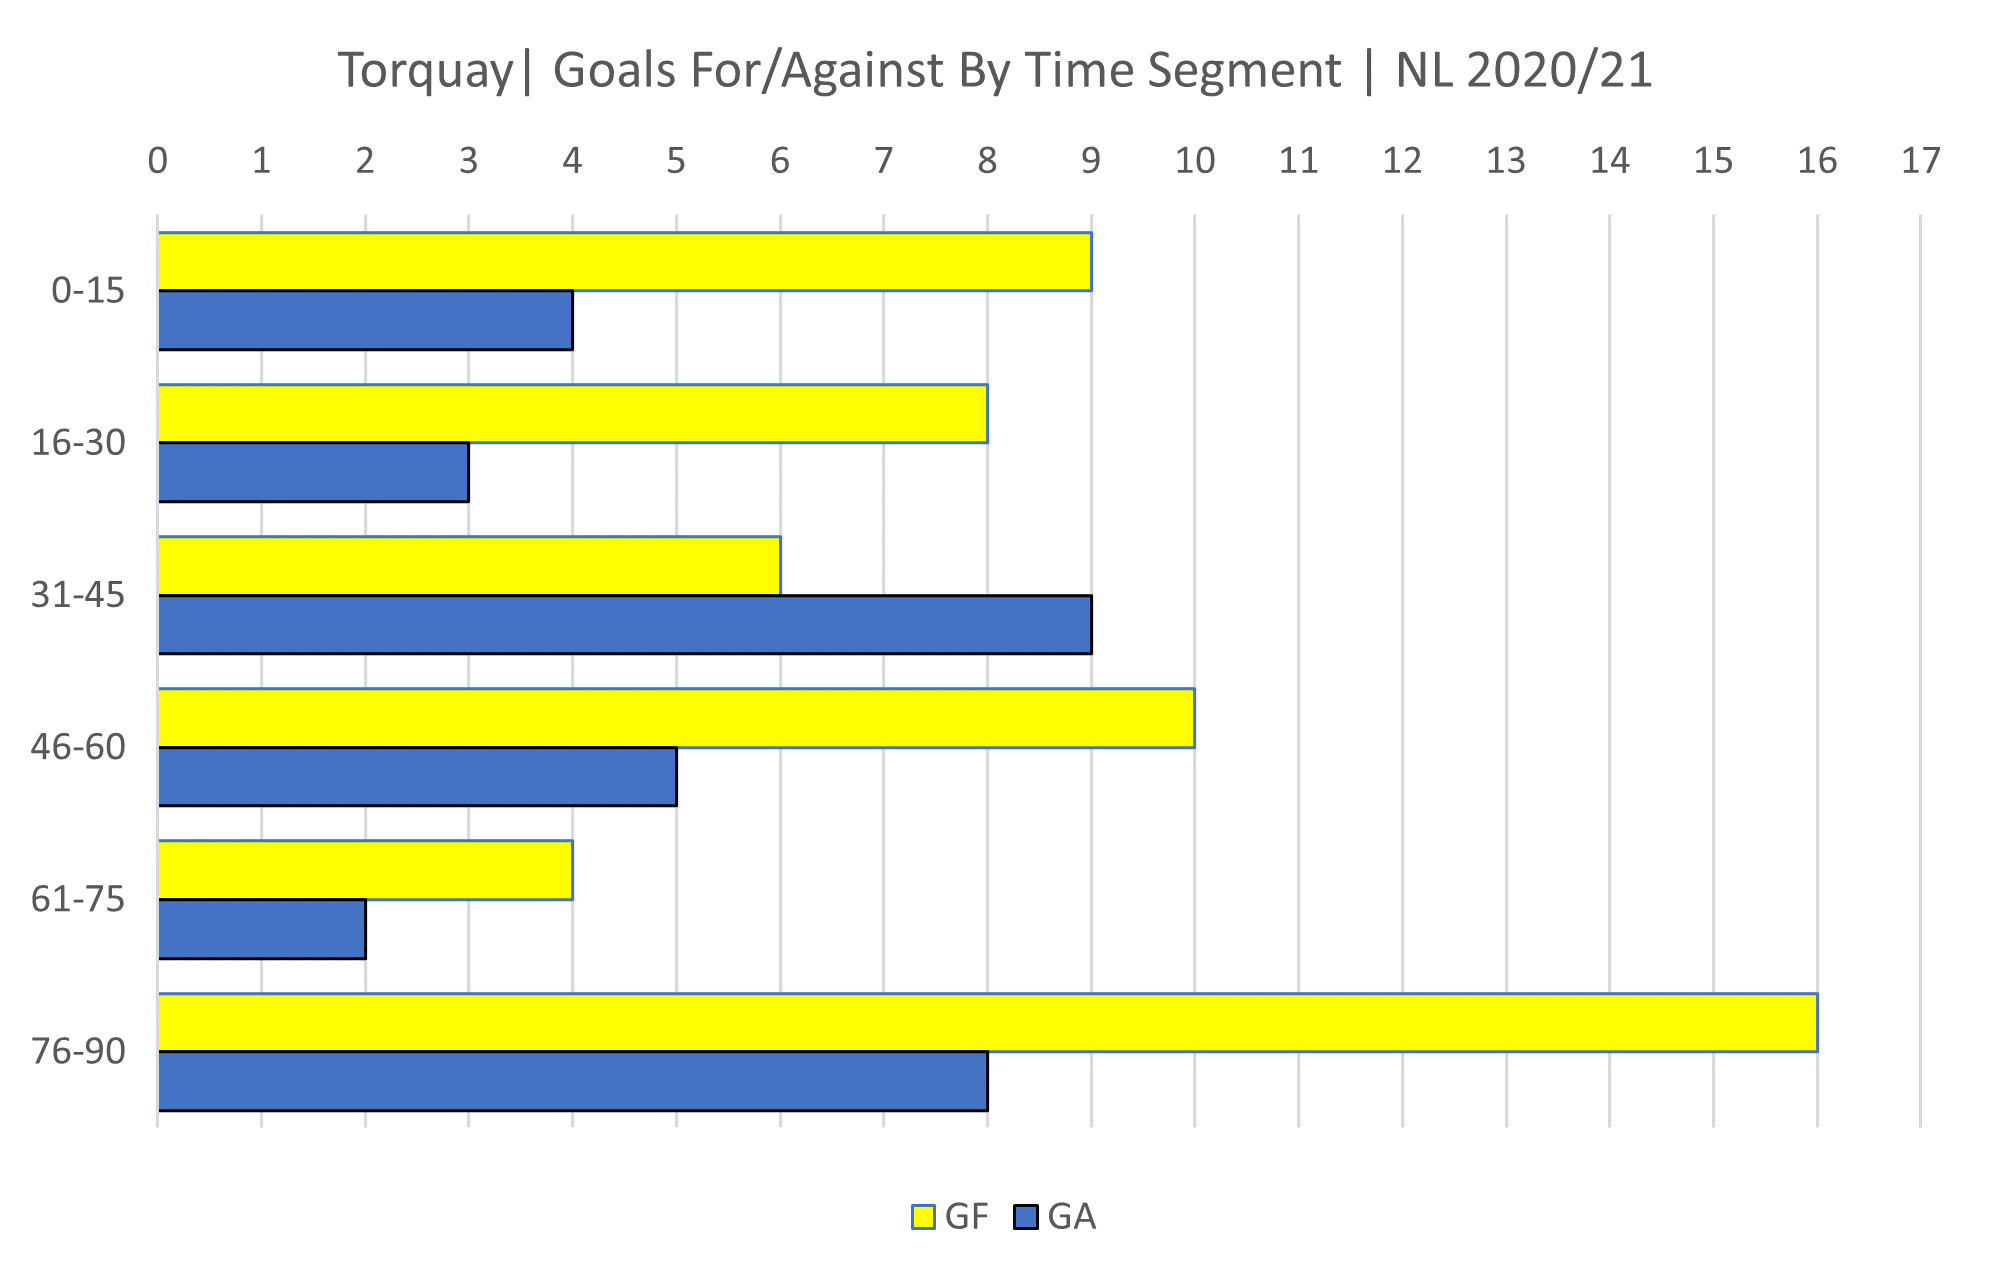
Goals for/against by time segment for Torquay and they do appear to come on strong in the last 15 mins.
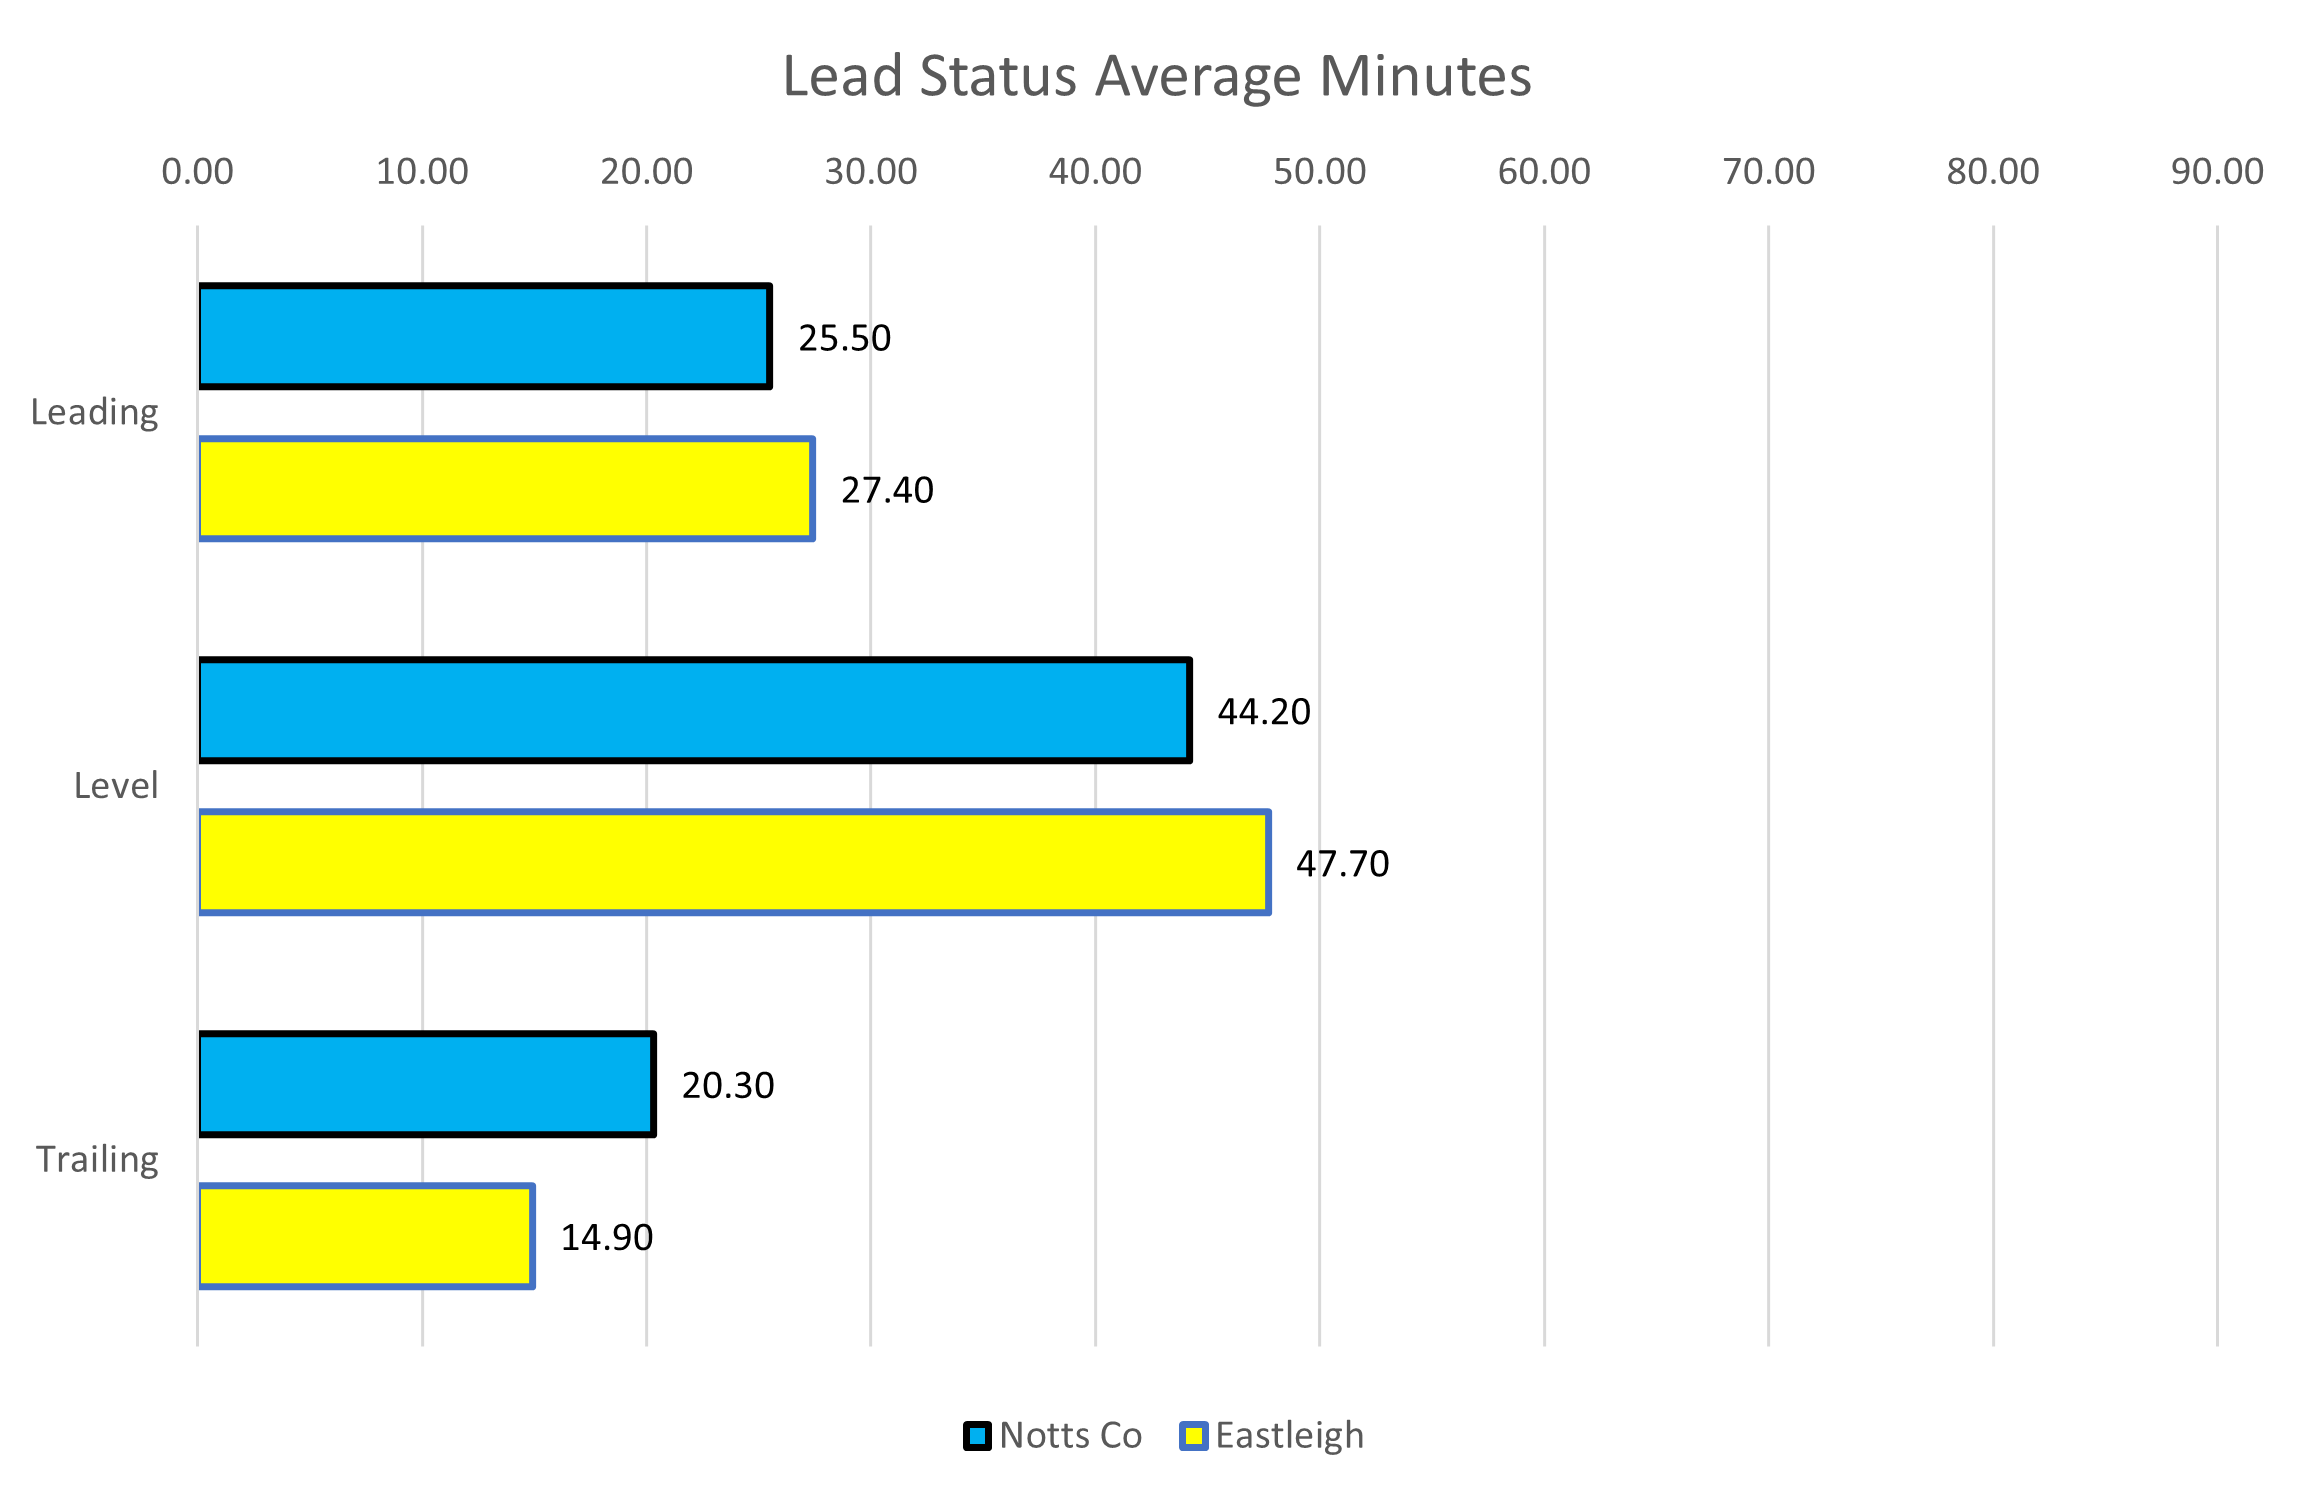
Lead status comparison and again it's Torquay who come out on top.
As expected Torquay are clear favourites for this encounter where you won't get much change out of odds of 11/10.
If you're feeling brave you can still get circa 21/10 on a Notts win and 12/5 still doesn't look a bad bet for the draw.
Based on these odds Notts have a 32% chance of winning but worth noting that they actually win 36% of games with these odds.
Torquay's odds mean they have a 48% chance of winning but normally only win 47% of games with these odds.
The head to head with Torquay is actually pretty good. Notts have faced the Seagulls on 45 occasions losing just 7 of those games. In fact the last defeat was in the FA Cup at Plainmoor in 2005. You have to go all the way back to 1966 for the last defeat in the league which again occurred at Plainmoor.
Record vs Torquay:
League
P 43 | W 19 | D 18 | L 6 | F 69 | A 37 | GD +32 | PPG 1.98
FA Cup
P 2 | W 1 | D 0 | L 1 | F 4 | A 2 | GD +2
Ian Burchnall has now had a full week to work with his players and if Connell Rawlinson's recent interview is anything to go by the player's have reacted positively to the new coach's techniques.
let's hope that positivity is carried over onto the pitch with an improved performance and hopefully a point or three in the bag to soften the long journey home.
COYP!
Richard