It's a funny old game. Just a couple of months ago we were seriously thinking of a title challenge, now there are serious concerns over making the play off's.
Some of the comments on social media and other public forums certainly give you an indication of the frustrations currently pouring out from some of the Notts fan base.
Personally, I'm not concerned. Yes of course I want out of this league as soon as possible and yes I'm completely despairing every time Notts fail to win, but there are many factors to consider regarding this current collapse in form.
We will never be able to cover them all in this update but hopefully I can point out a few key areas for consideration as we trawl through the stats following the defeat at Eastleigh and look ahead to the game at Altrincham on Saturday.
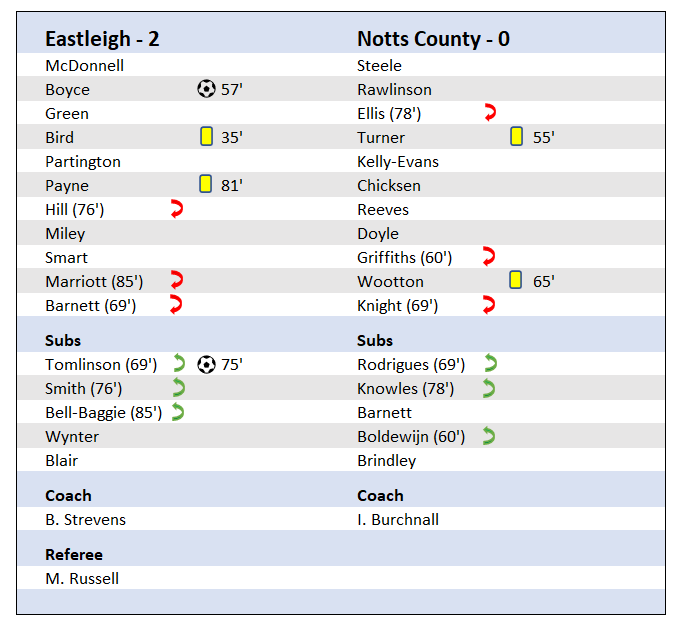
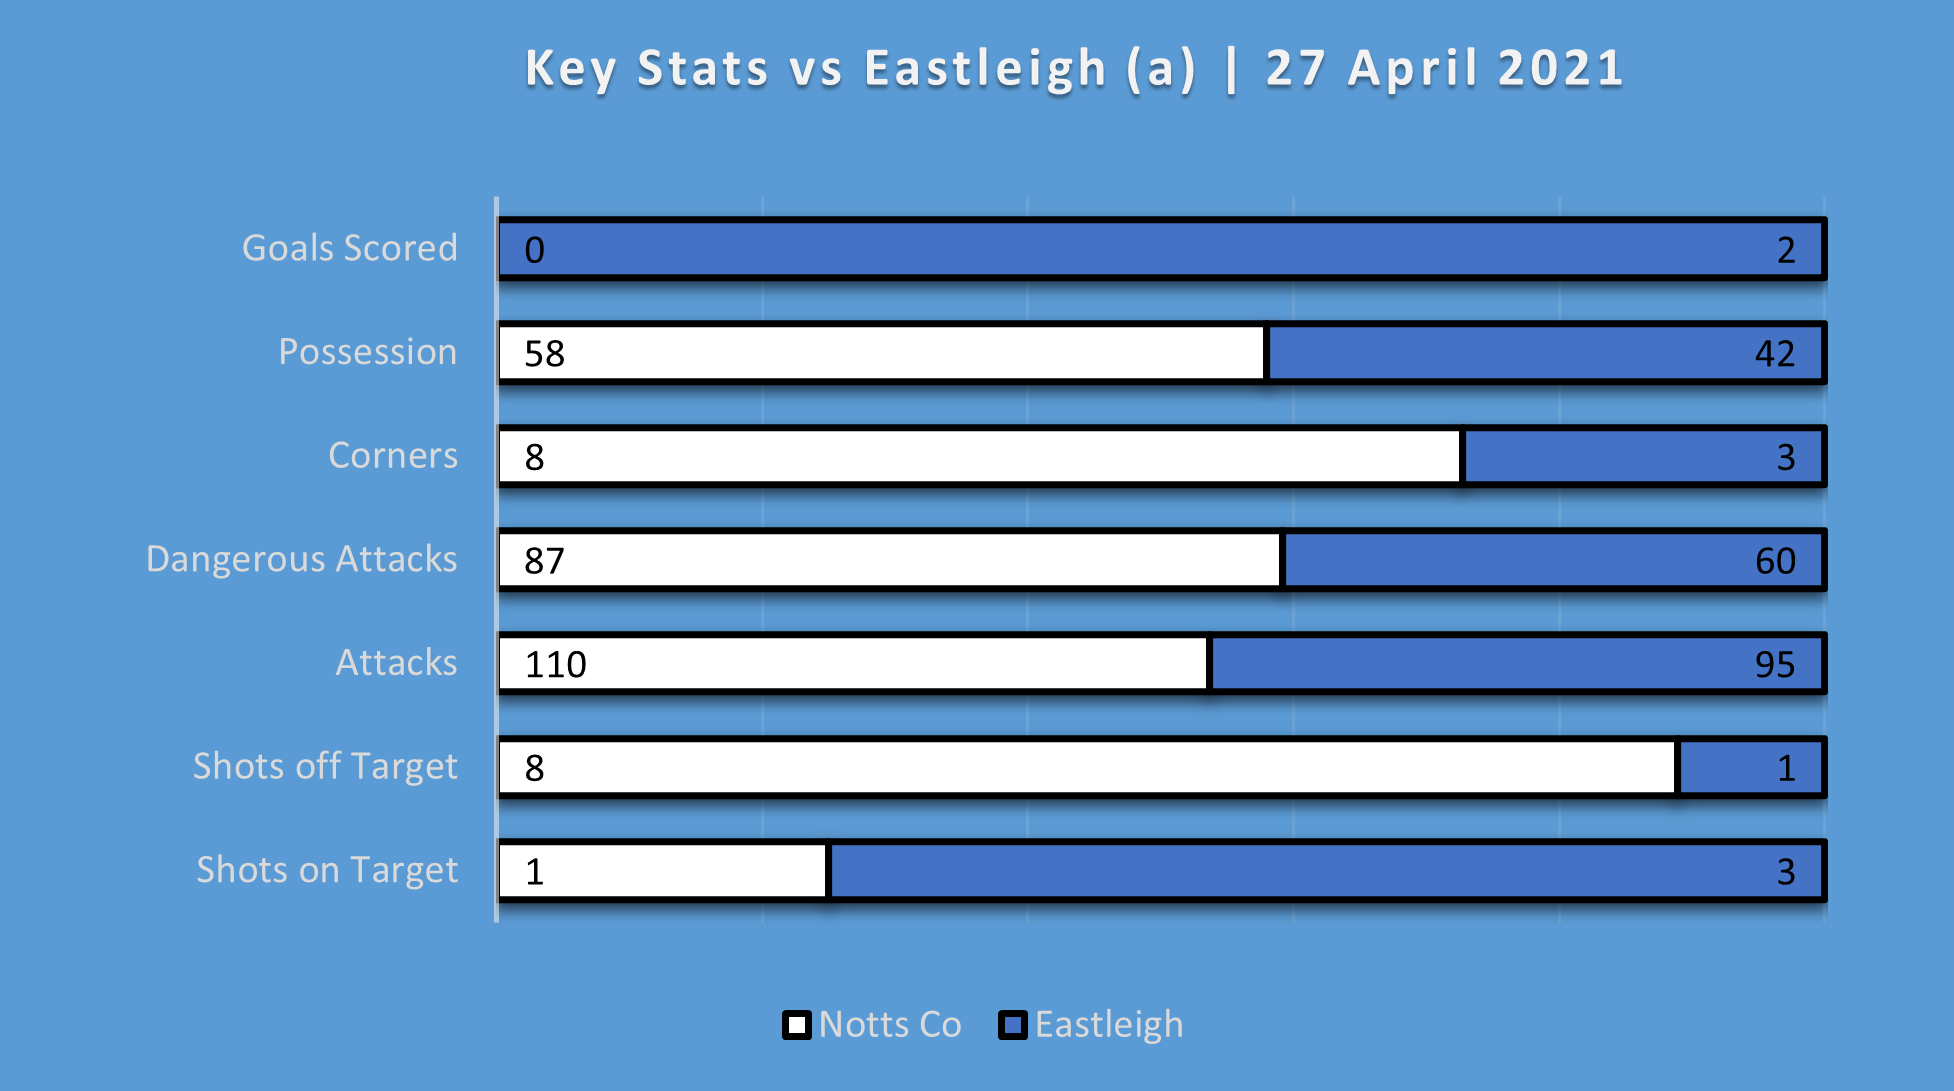
Match stats below and despite the score Notts actually created the lion's share of the chances. The data below comes from an external source, it's apparent the person collecting the stats had an off day because we certainly had more than one attempt on target!
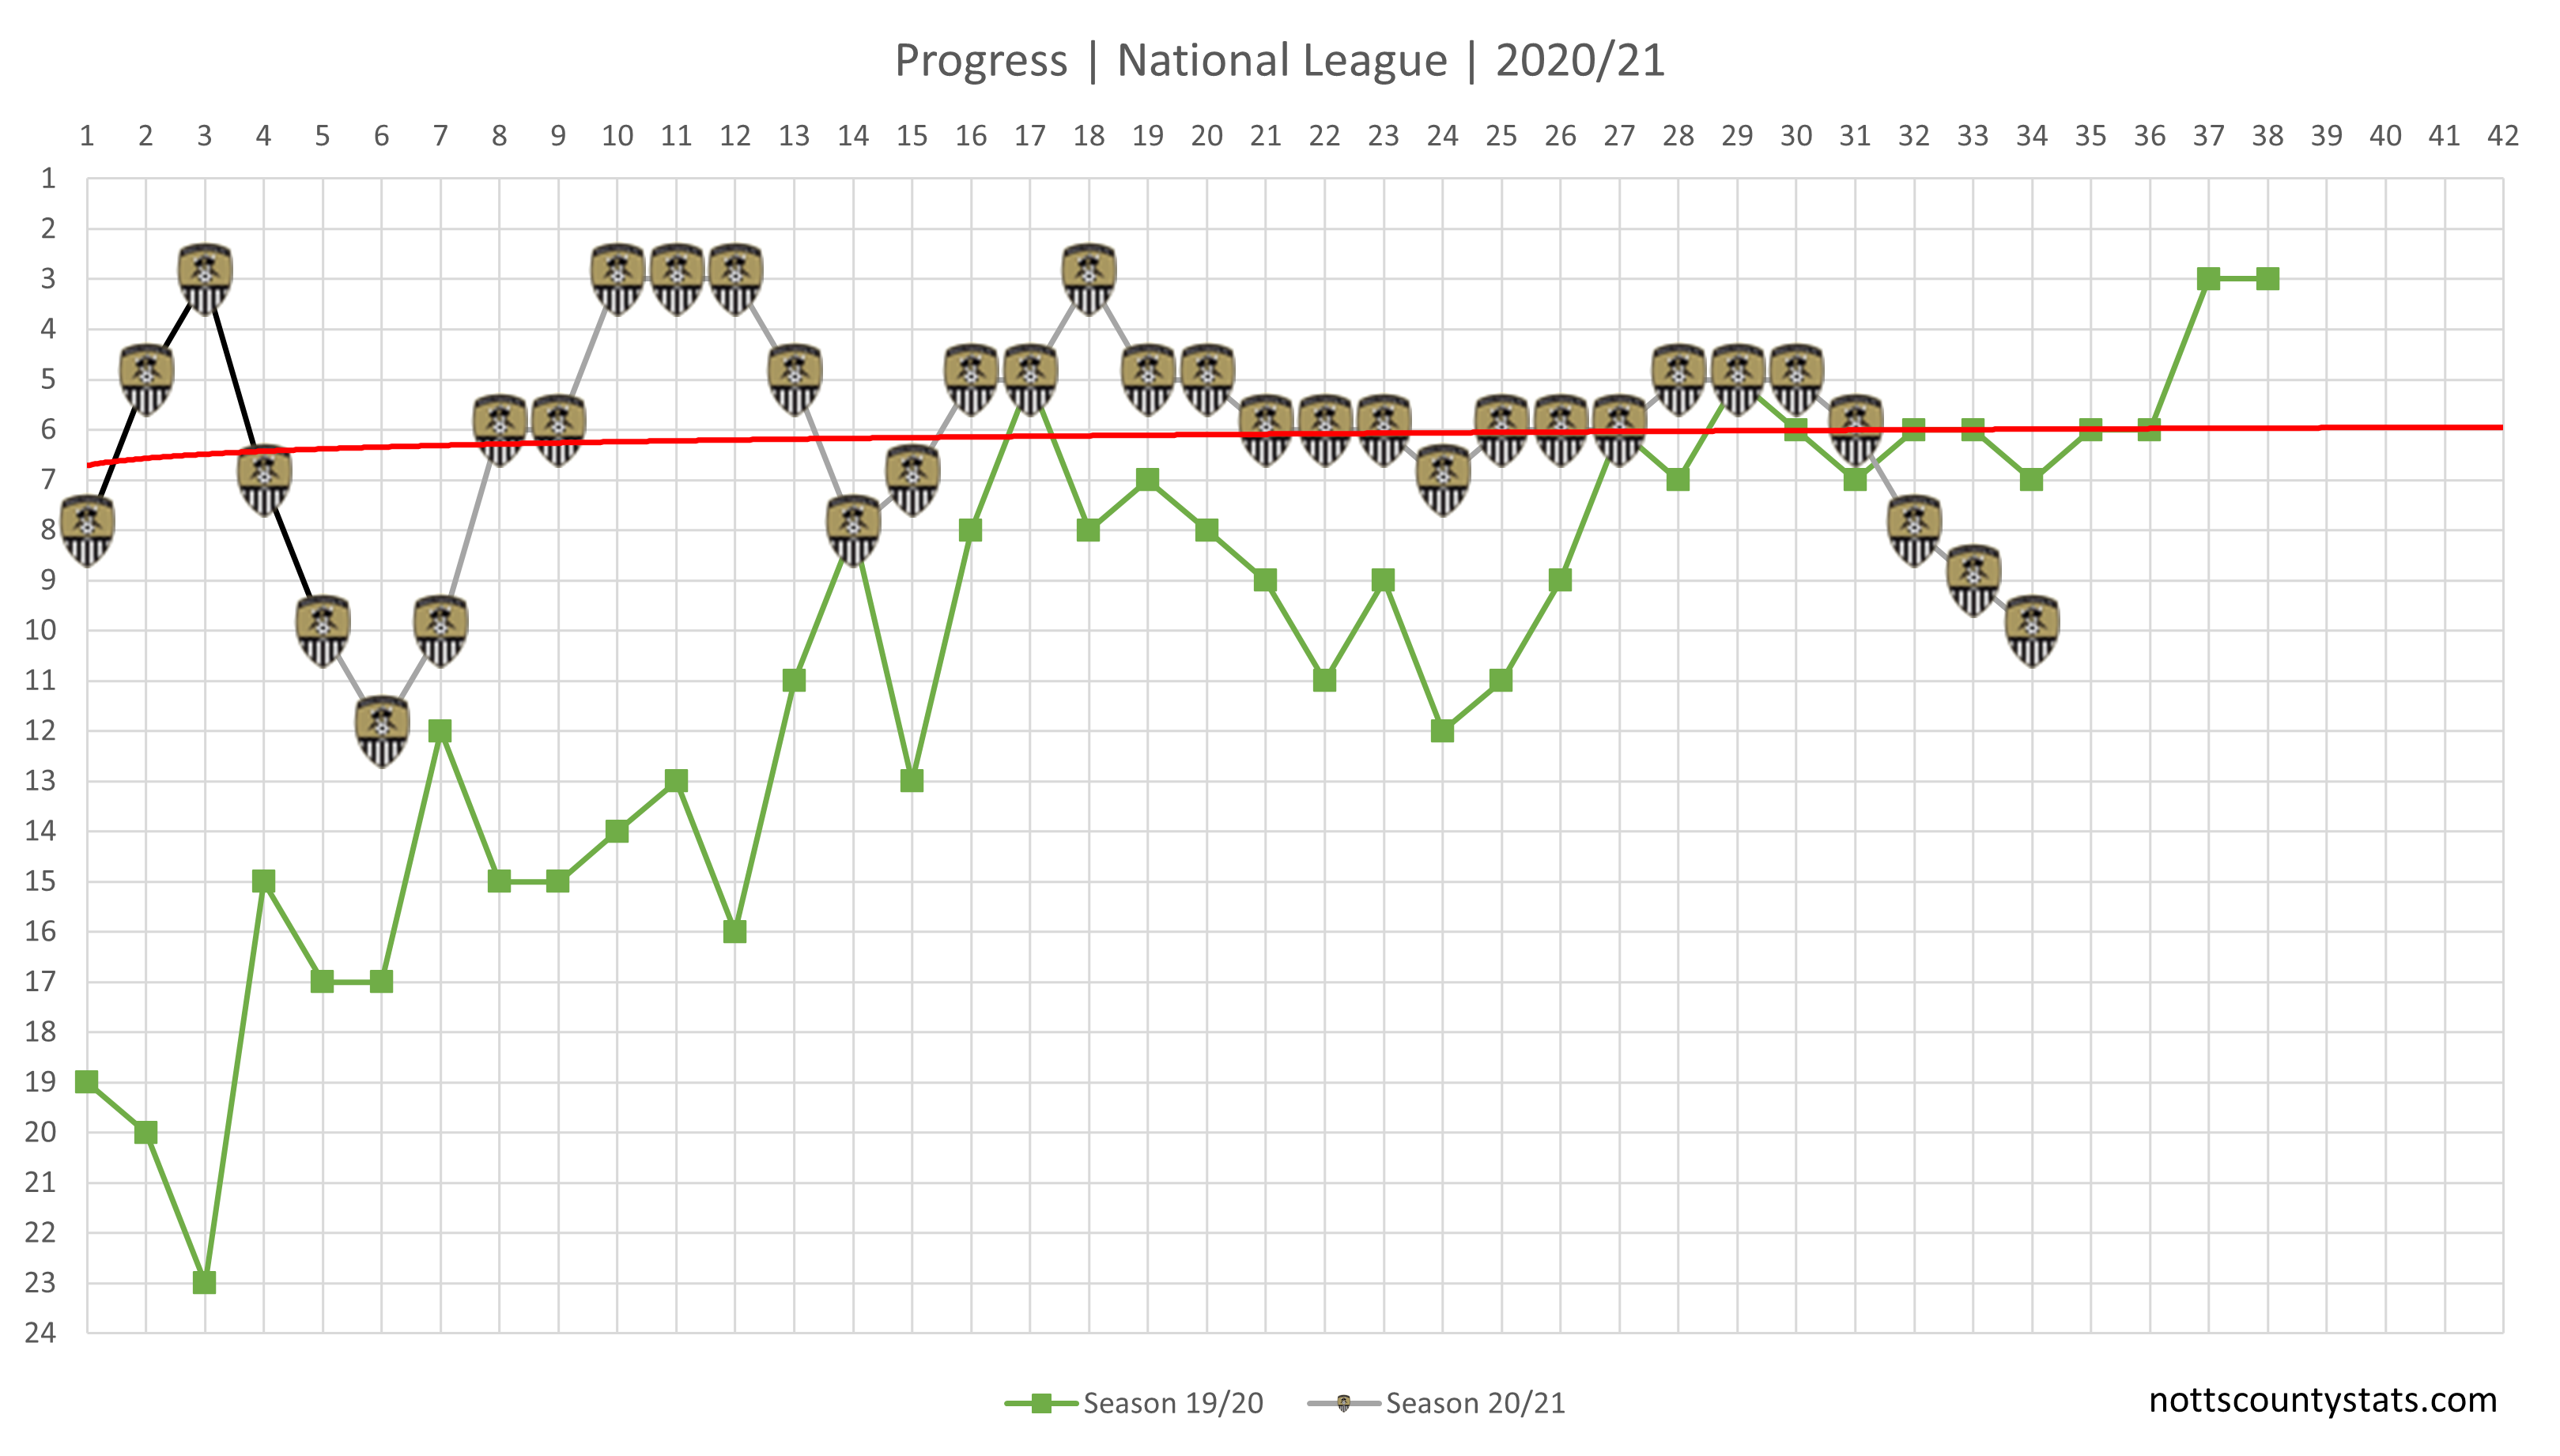
Progress updated. Down to 10th and 3 points off the play offs but still with a game or two in hand which despite current form still offers some hope of a top 7 finish.
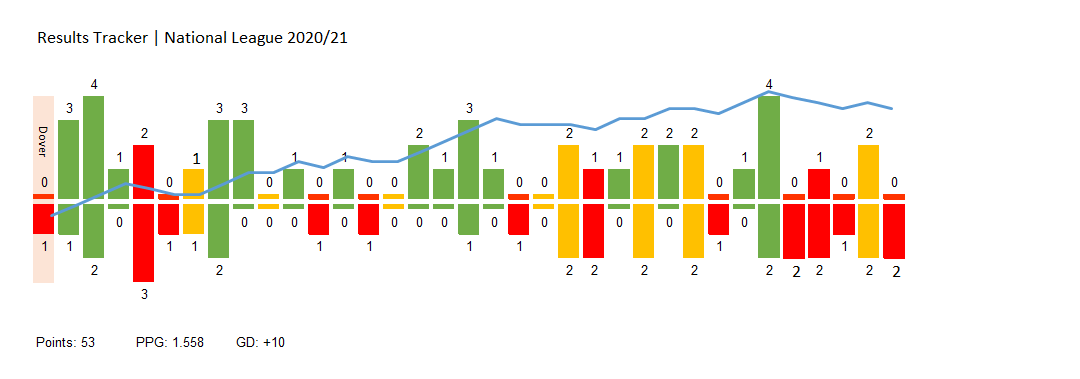
Results tracker updated including progress visual.
Points needed now with adjusted targets to represent predicted points totals for the current season. As mentioned in the progress chart, despite recent form Notts are still clinging on to a play off spot based on PPG.
You can filter the chart by clicking on the legends at the top.
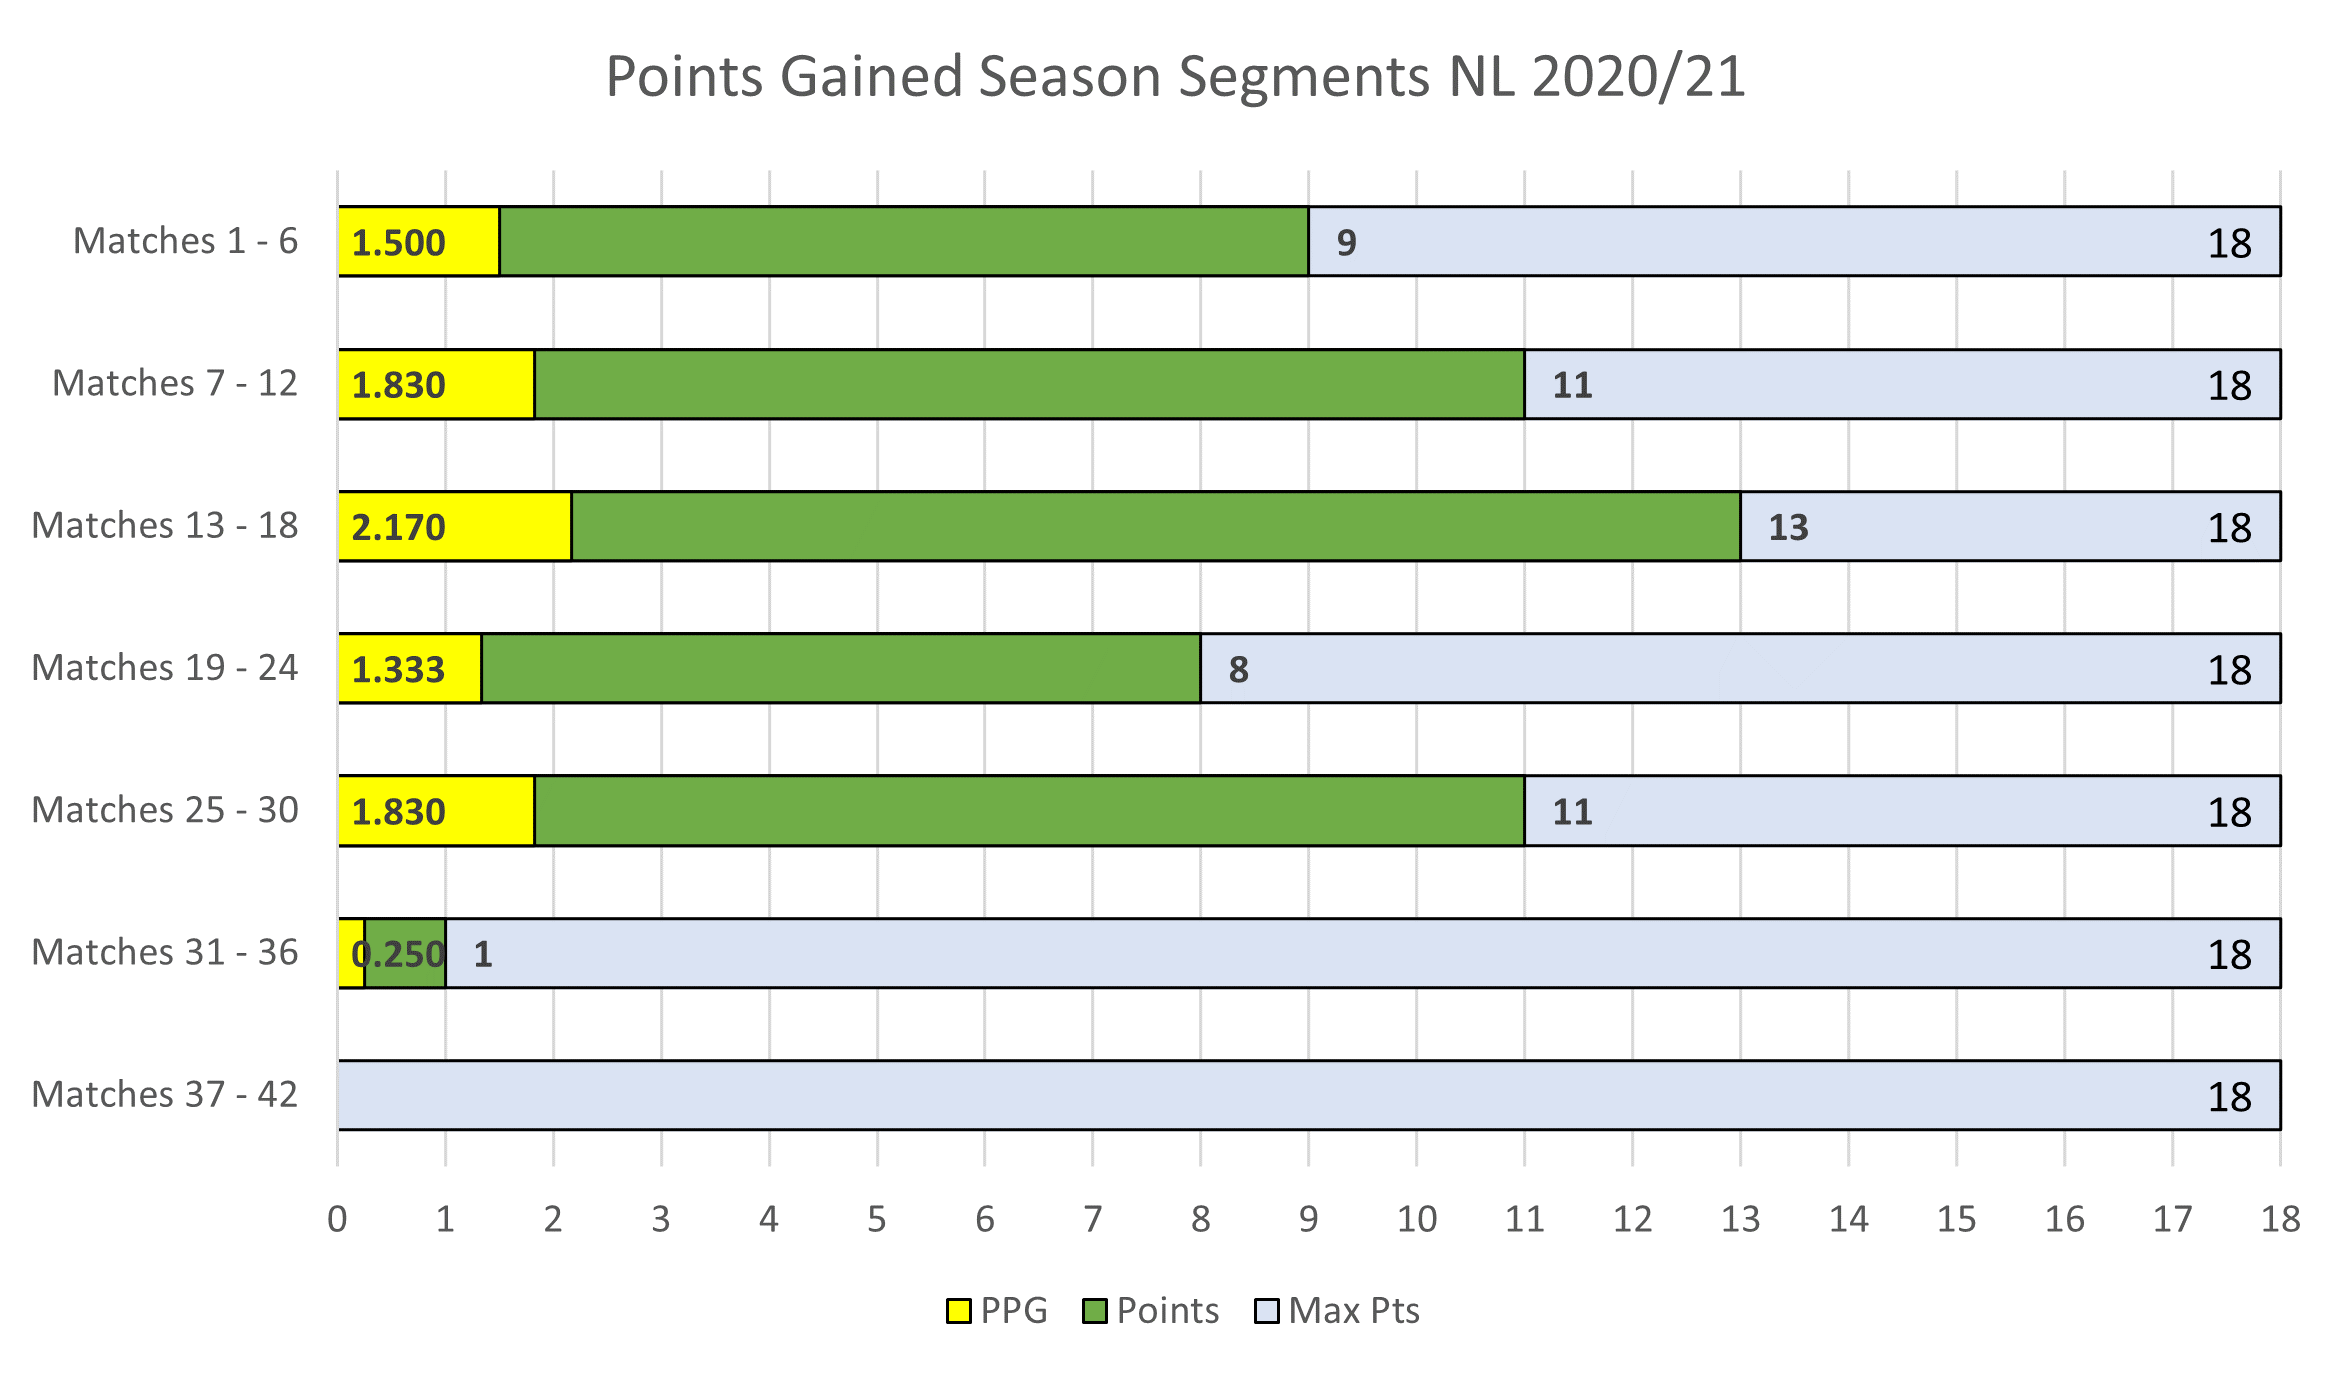
League segment chart updated. Grey bar shows total points available for that segment. Green bar shows total points gained and yellow bar the PPG for that segment.
Altrincham away on Saturday will be the 5th match in this 6 game segment. Current PPG for the 4 games so far is 0.250.
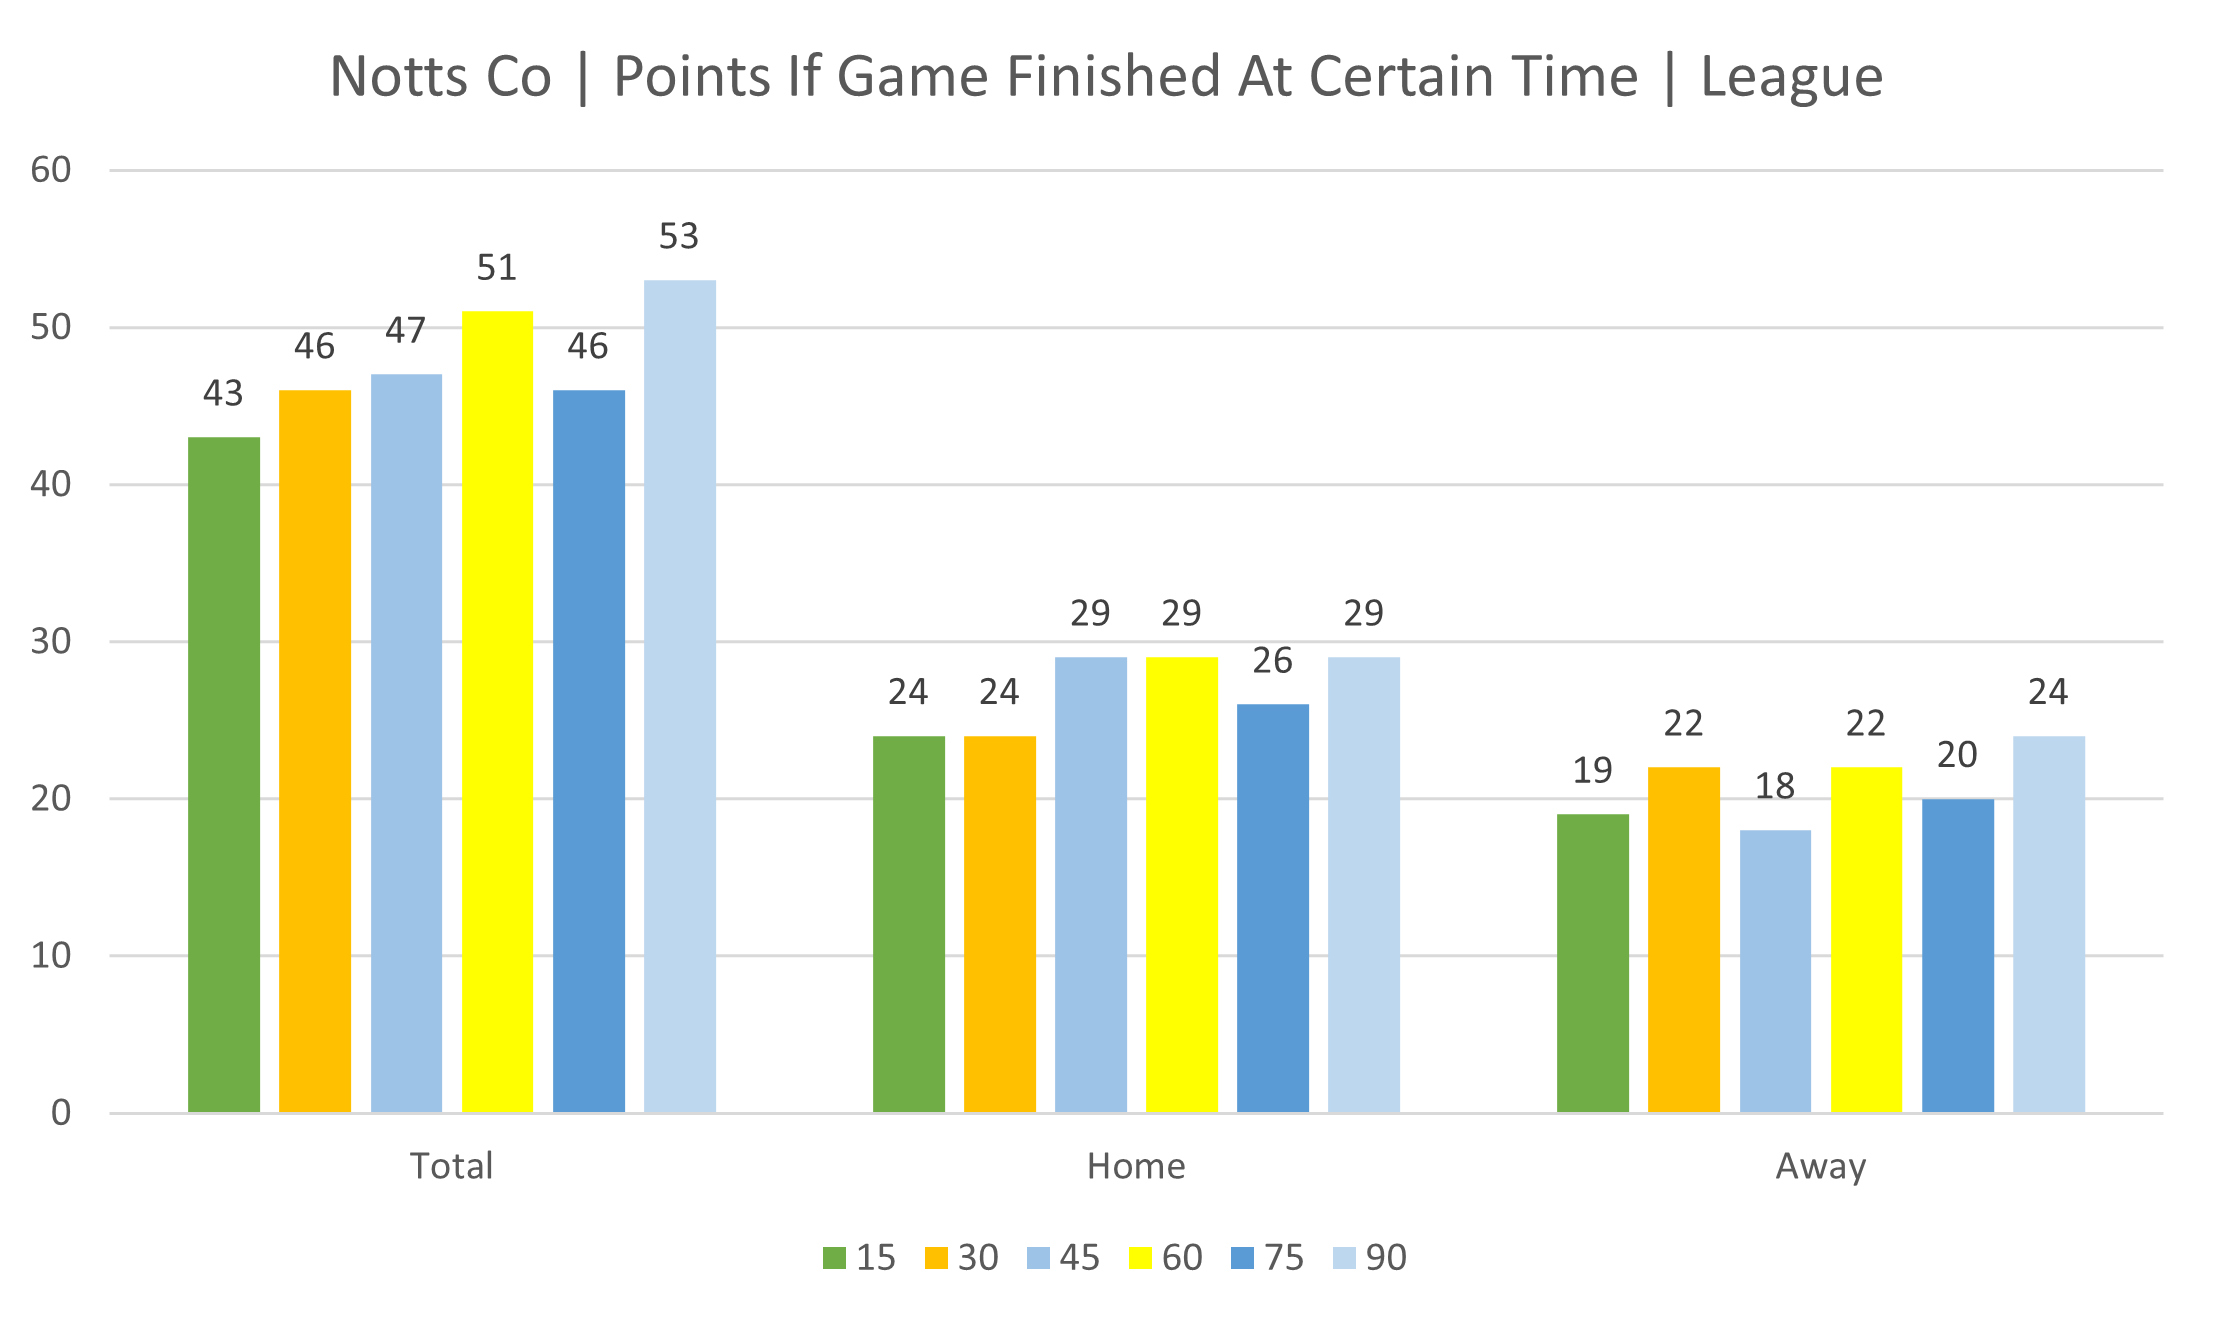
Points by time segment. How many points would have been accumulated if games had finished at 15, 30, 45, 60, 75 and 90 minutes.
What this does tell us is that for a large part of this season Notts have not imposed themselves enough early on in games instead relying on a late rally to salvage points.
Onto player stats now and remember you can use the search function to see individual players or click on a column heading to sort highest to lowest etc.
As you may have noticed I've been applying player ratings which have been adding up after every game. These ratings cover a variety of metrics and are weighted to ensure there is no discrimination between player positions etc.
I've kept a running total and a rating per minute. Would be interested to hear any feedback or thoughts on how the ratings currently stack up.
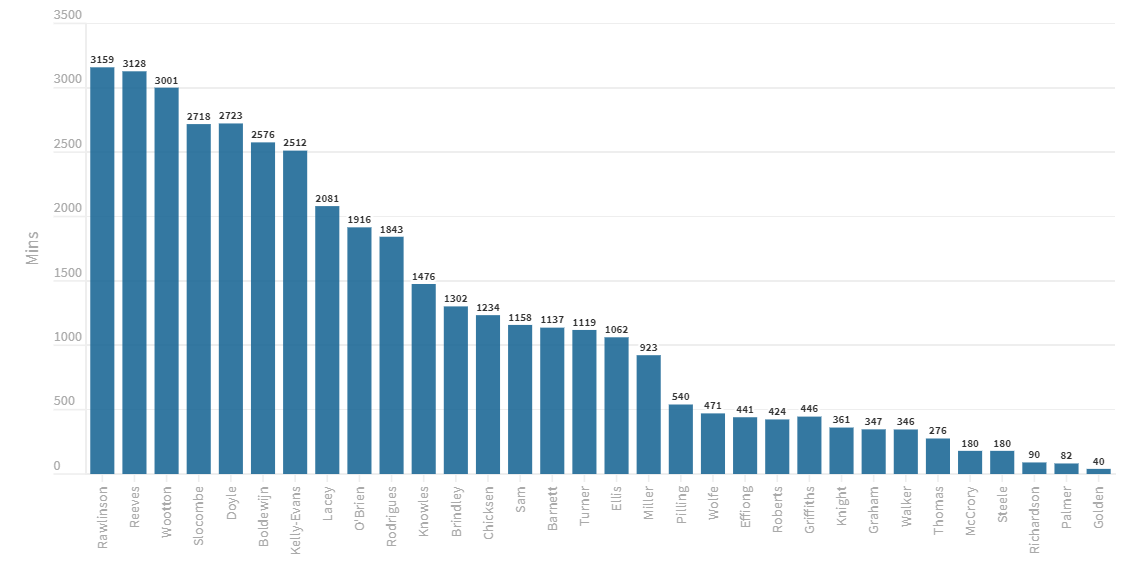
Minutes played updated:
Goal contribution table updated. Again, you can find this on the website and sort columns etc.
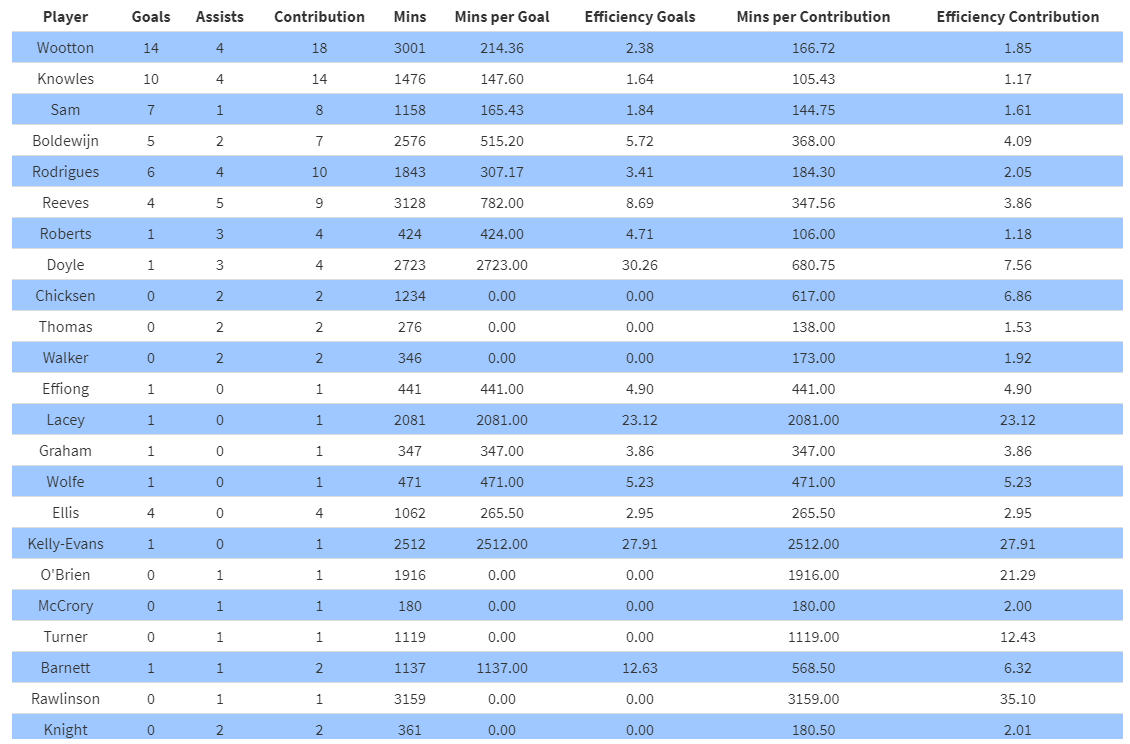
Goal participation by minute detailing player goal contribution efficiency. I'll be looking to change this slightly for next season providing I can obtain more detailed data. This currently takes goals and assists divided by minutes played to provide a value in minutes that shows how many minutes pass between that player being involved in a goal. What I'll be hoping to do is include further detail in this that goes beyond just goals and assists to determine true influence. Watch this space.
Goals scatter chart updated.
Goals by time segment updated and 50% of goals conceded have come in the last 30 minutes.
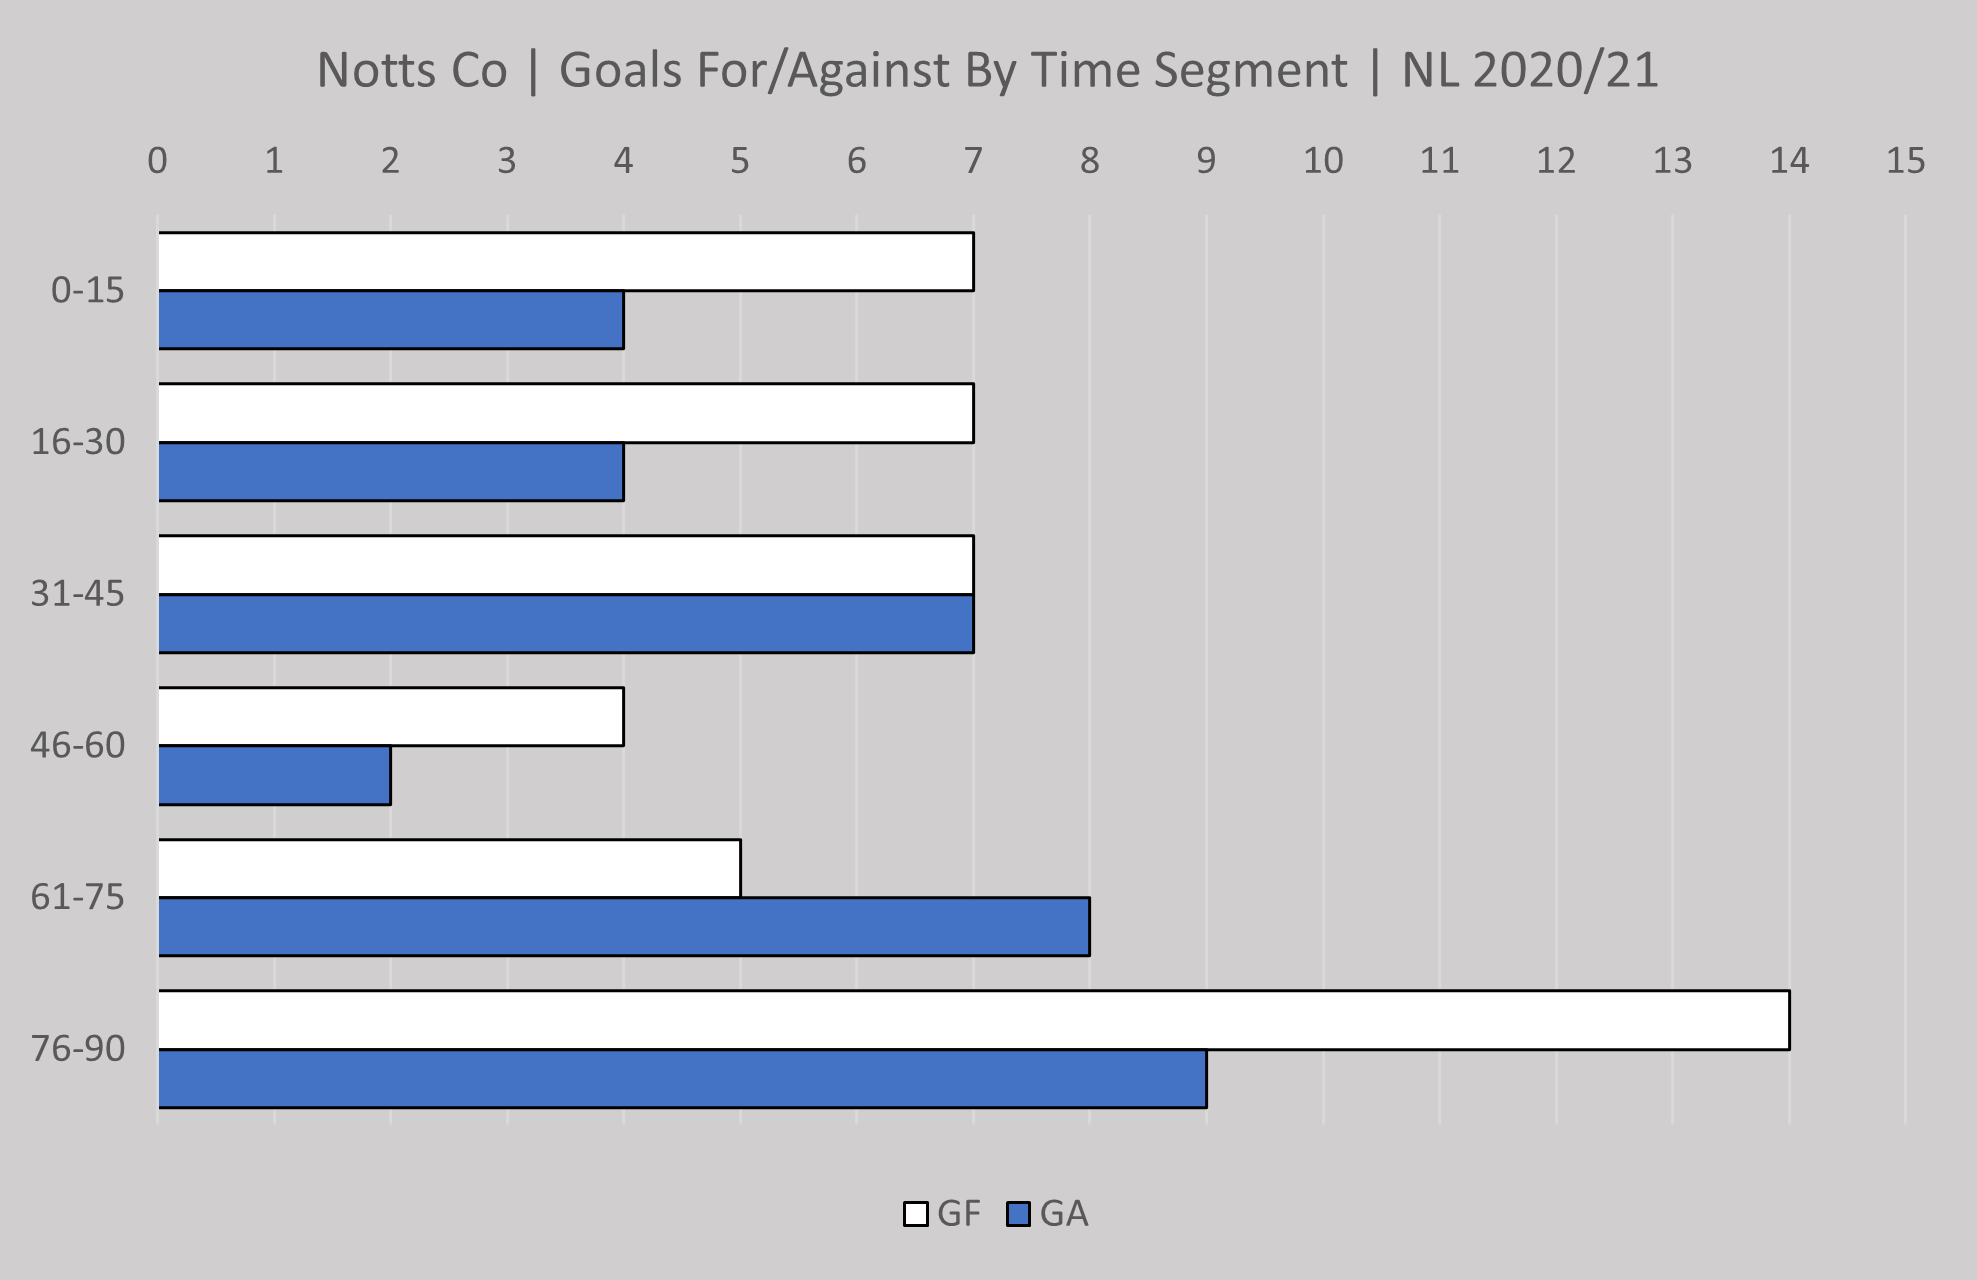
Ian Burchnall's record updated after 9 games in charge.

Before we move onto the xG data for the Eastleigh game now might be a good time to try and explain my comments at the beginning of this update.
There is no denying that results since Ian Birchnall and Maurice Ross took over coaching duties at Meadow Lane have not been great. Two wins and one draw in their first eight league games really does take some defending, and whilst they are not exonerated from any blame they certainly are not the sole architects of this current slide in form.
I'm going to get all xG on you again now, I know, I'm sorry, but it is something that holds some merit in trying to decipher recent results as well as considering how this might impact future results/performances.
Those of you who have been following my updates for a while will know how much faith I put in xG data and throughout this season I've been using this to explain how data is used to identify performance regardless of results.
A couple of articles ago I posted some xG analysis which looked at expected goals for and against as well as expected and actual points for both last season and this one.
This clearly highlighted the fact that Notts had for the most part been over achieving. By that I mean winning points where they weren't expected or where the performance didn't merit it.
Last night I was fortunate enough to guest again on Notts County Talk with Tom and George and they were great in allowing me to try and explain why despite the results I'm not overly concerned about the start Ian and Mo have had to their tenure.
I would encourage you to watch if you can but the crux of it is based on the data if games had finished as expected using the fair score scenario Notts would have been 7 points worse off than they were under Neal Ardley's tenure.
Now if we do the same again for the 8 games under Ian Burchnall Notts should actually be 8 points better off than they are for these games. This is a clear indication that the players are now playing a much more offensive style of play and creating more chances than earlier in the season which is what all of us were screaming out for.
Obviously there are two key areas that now need addressing to ensure we turn those expected points into actual points. Cut out the silly mistakes at the back and find some shooting boots for Kyle Wootton!
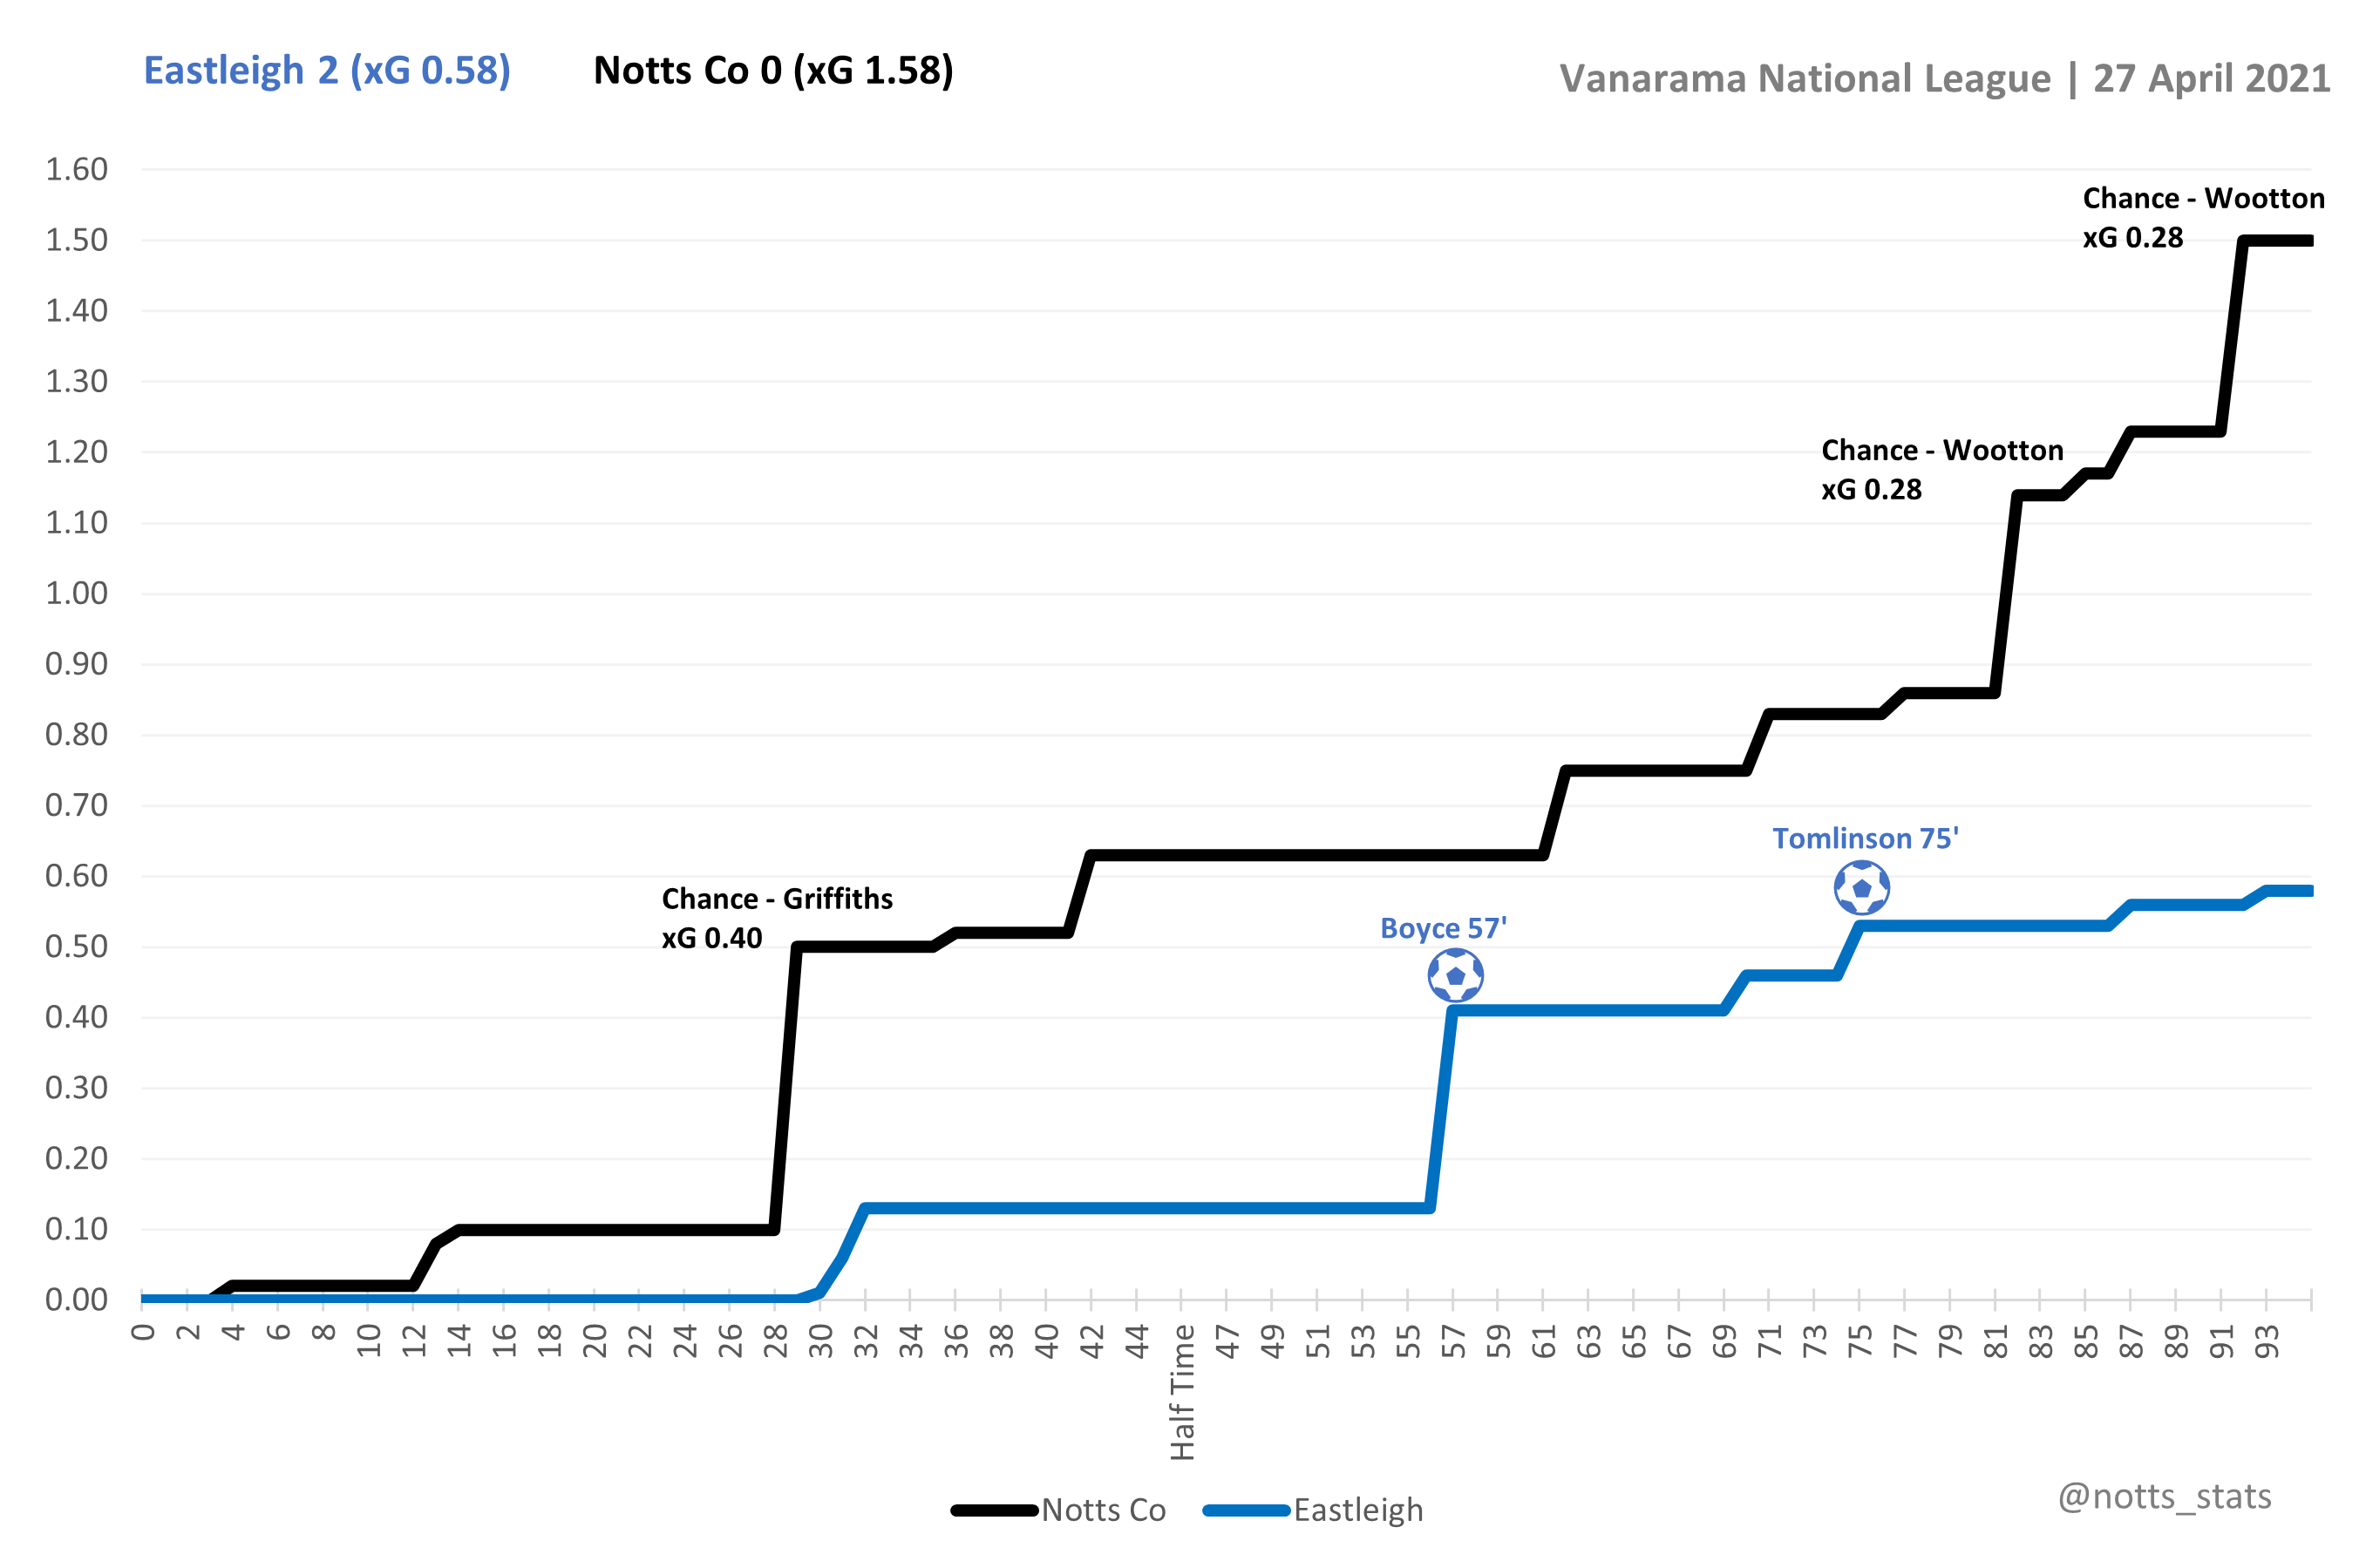
Below are the xG stats from the Eastleigh game and if ever we wanted proof of how this fair score analysis works this is a good example.
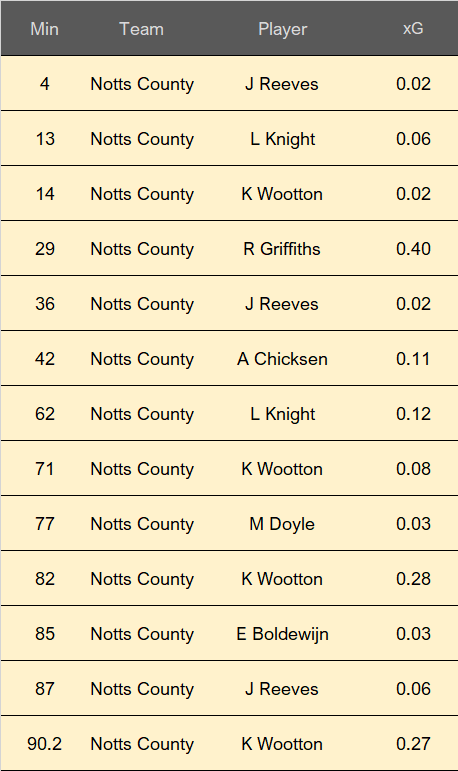
Notts were a constant threat pretty much throughout the whole game recording an xG three times higher than Eastleigh. Griffiths' header that was saved by McDonell was the games biggest chance and Wootton had two good chances late on.
Their second goal by Tomlinson had a relatively low xG rating of 0.07 suggesting that either it was a very good finish or maybe Steele should have done a bit better in goal.
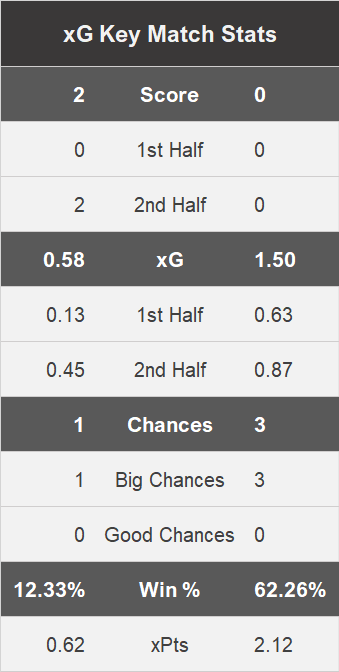
xG key match stats and to further emphasise the point Notts expected win percentage was 62.26% and xPTS of 2.12 meaning they would have been expected to win the game comfortably.
Player xG below again highlighting the big chances for Griffiths and Wootton.
Preview | Altrincham (a) | Vanarama National League | 15:00
Saturday 1st May 2021 | Moss Lane
After two long trips down south Notts head north on Saturday to face an out of form Altrincham at Moss Lane.
The Robins welcome the Magpies on the back of 4 straight defeats having conceded 10 goals in those games.
Notts as we know are desperately searching for their first win in 5 games.
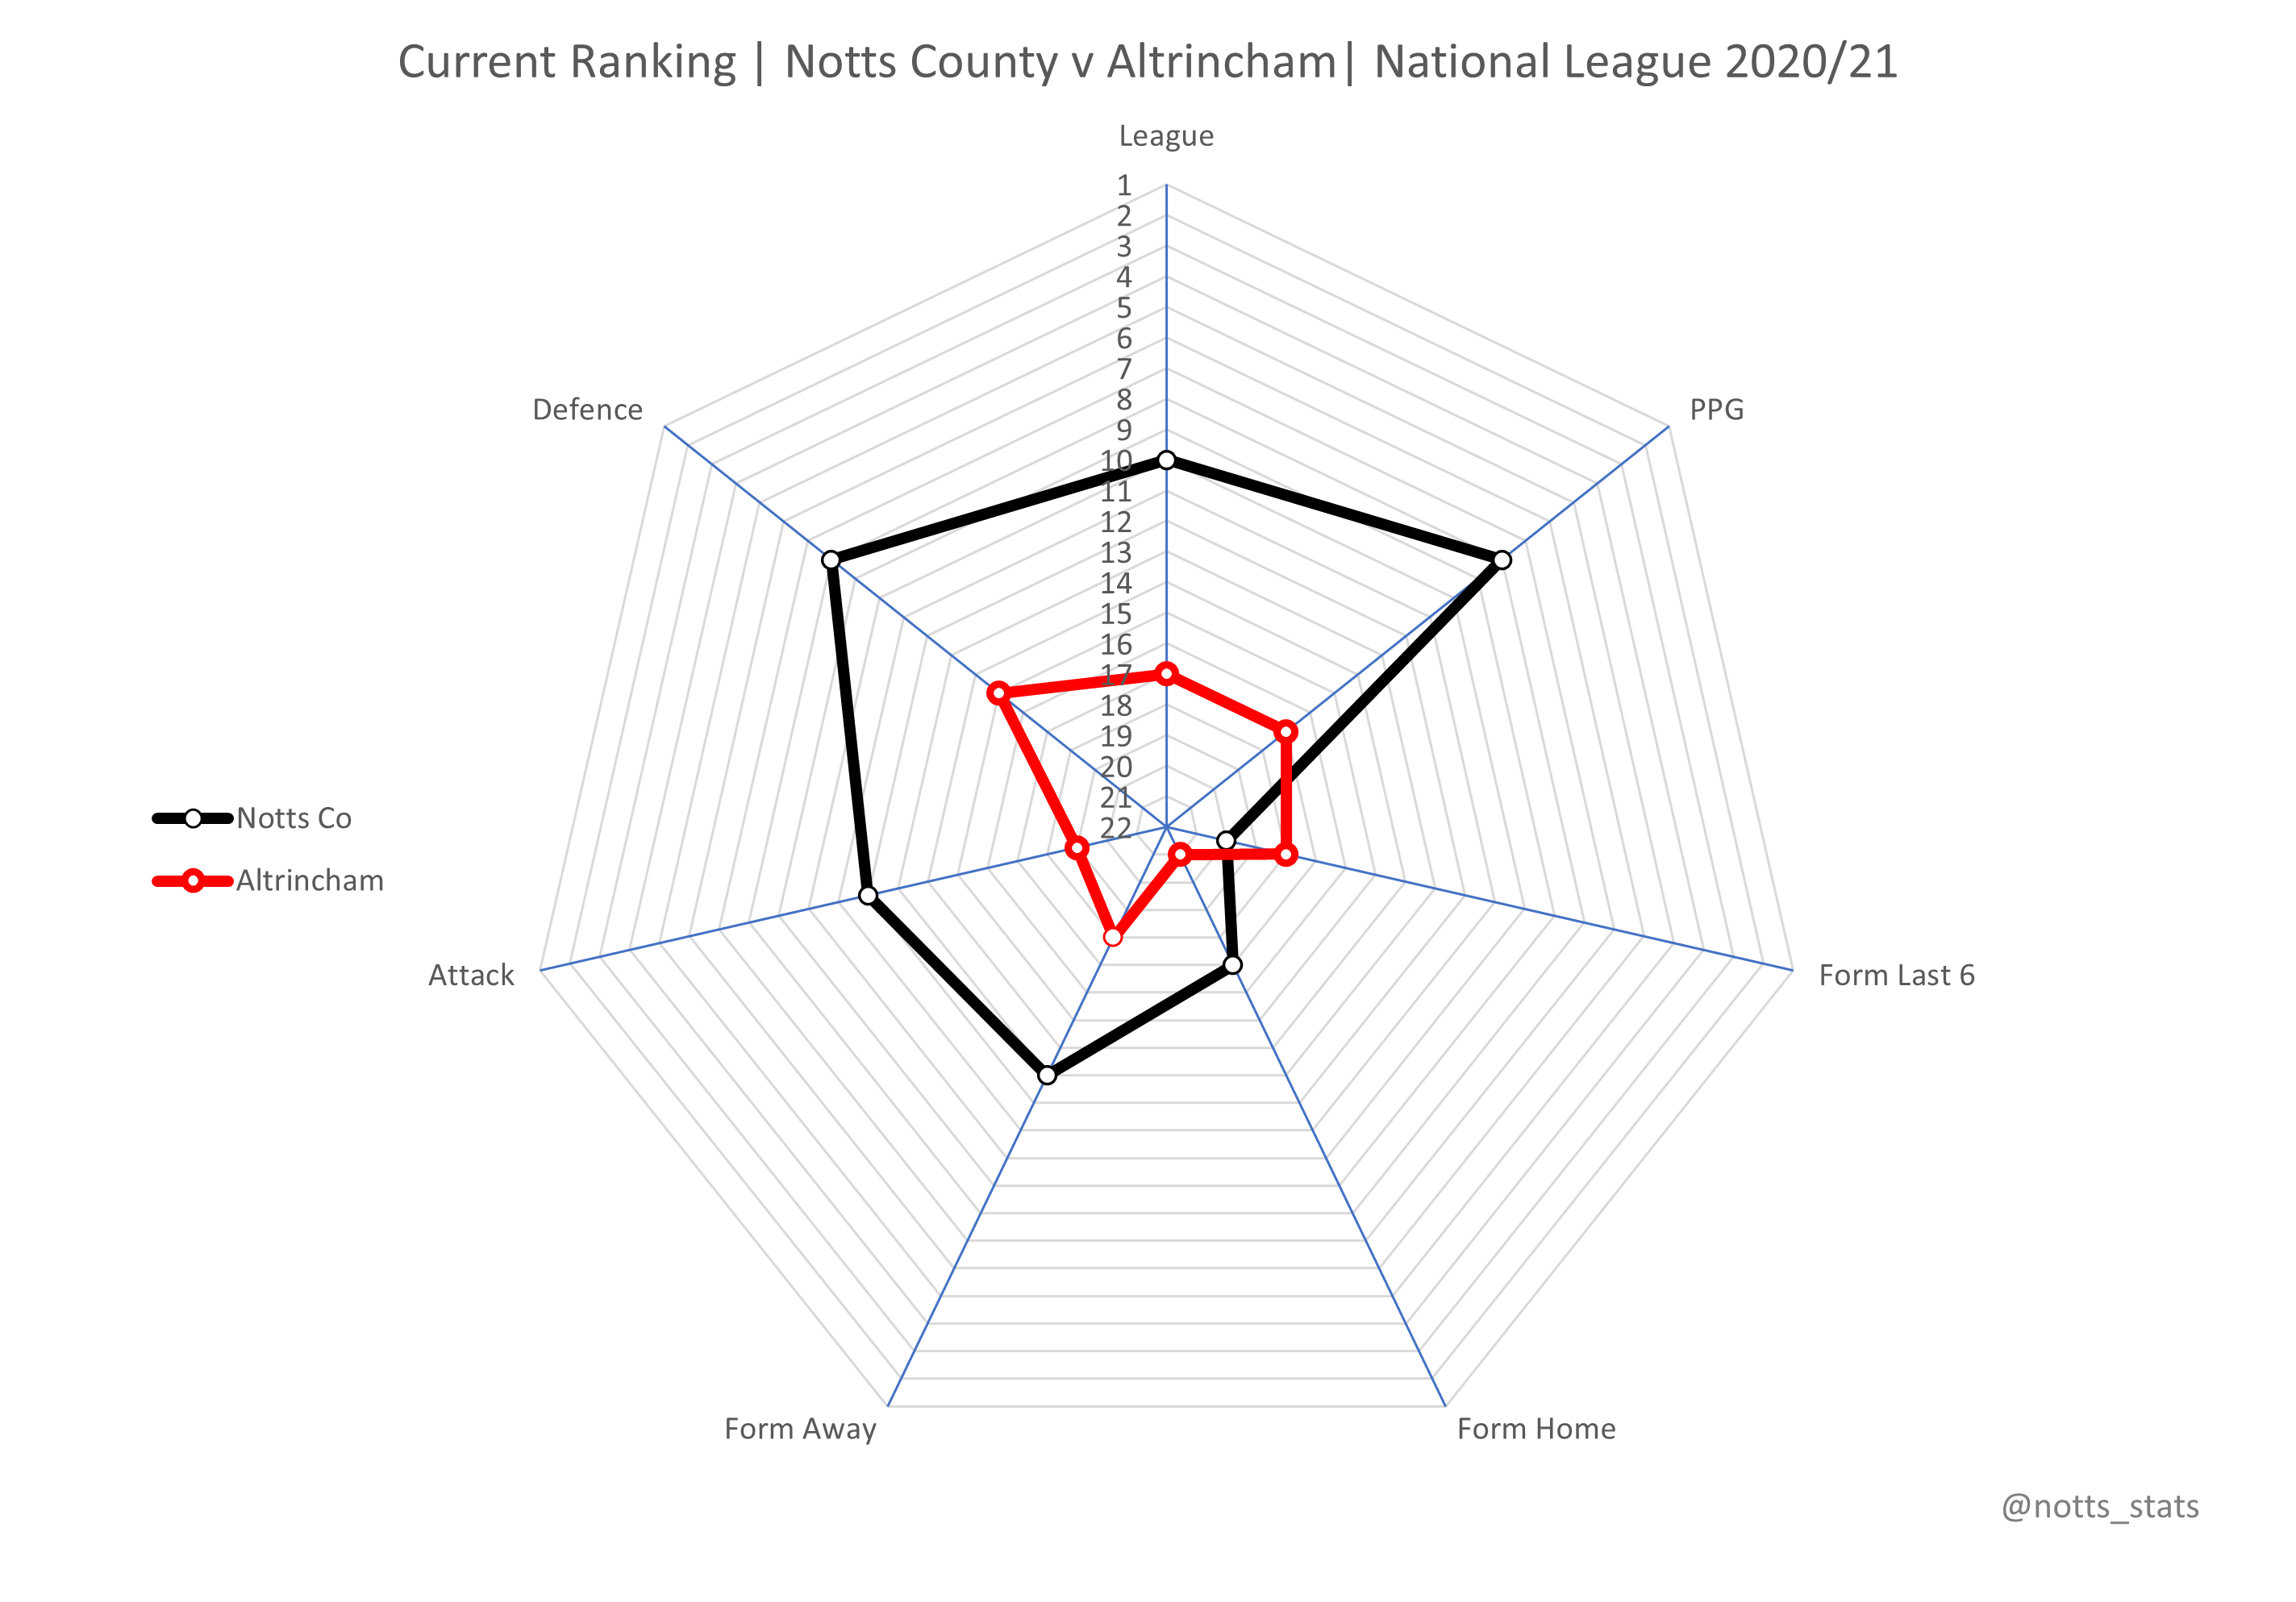
Current form radar below and Altrincham looking very poor in all areas.
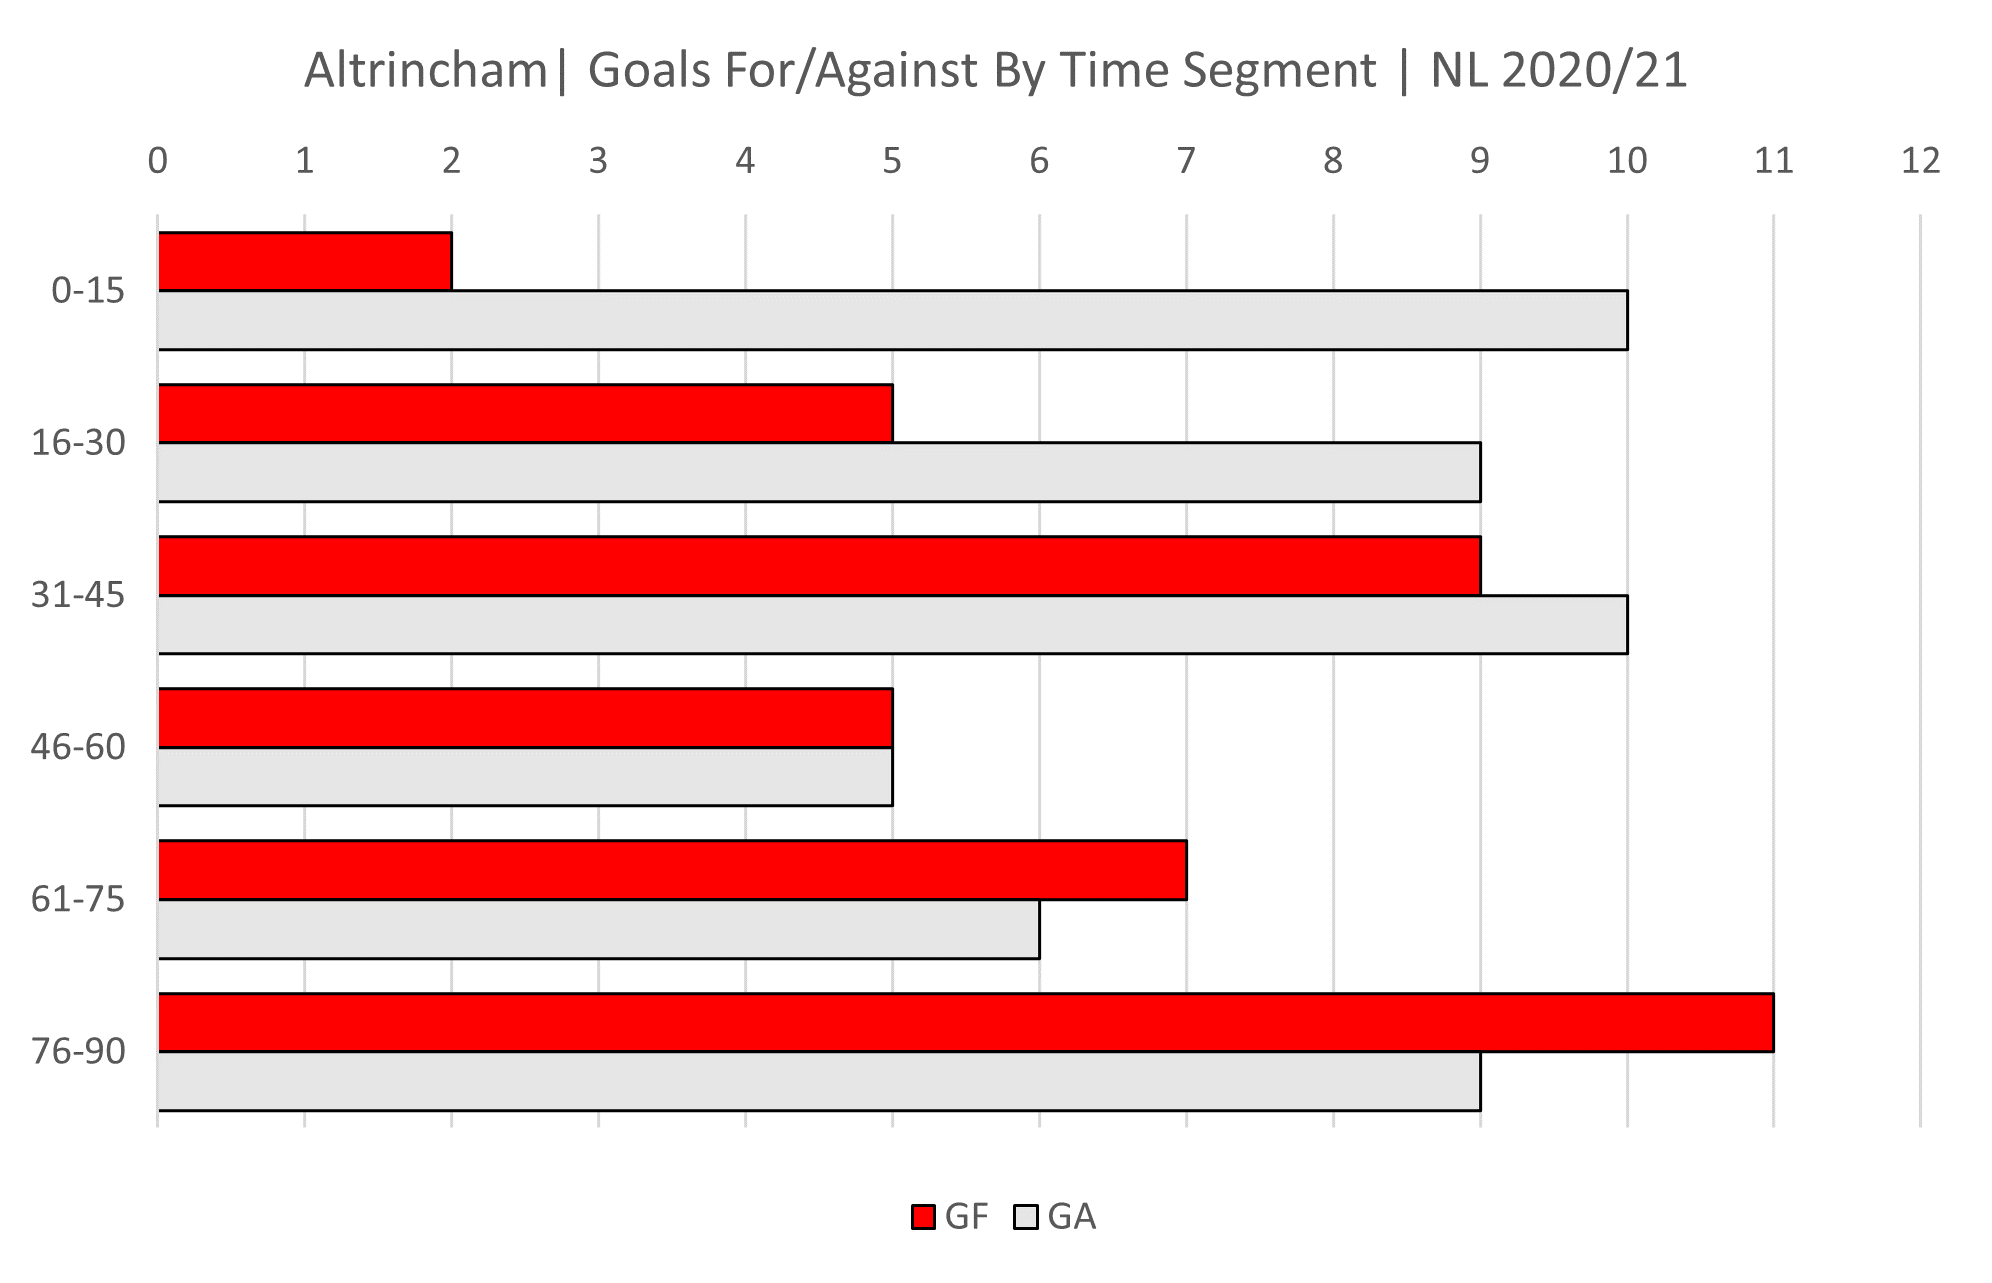
Goals for/against by time segment for Altrincham.
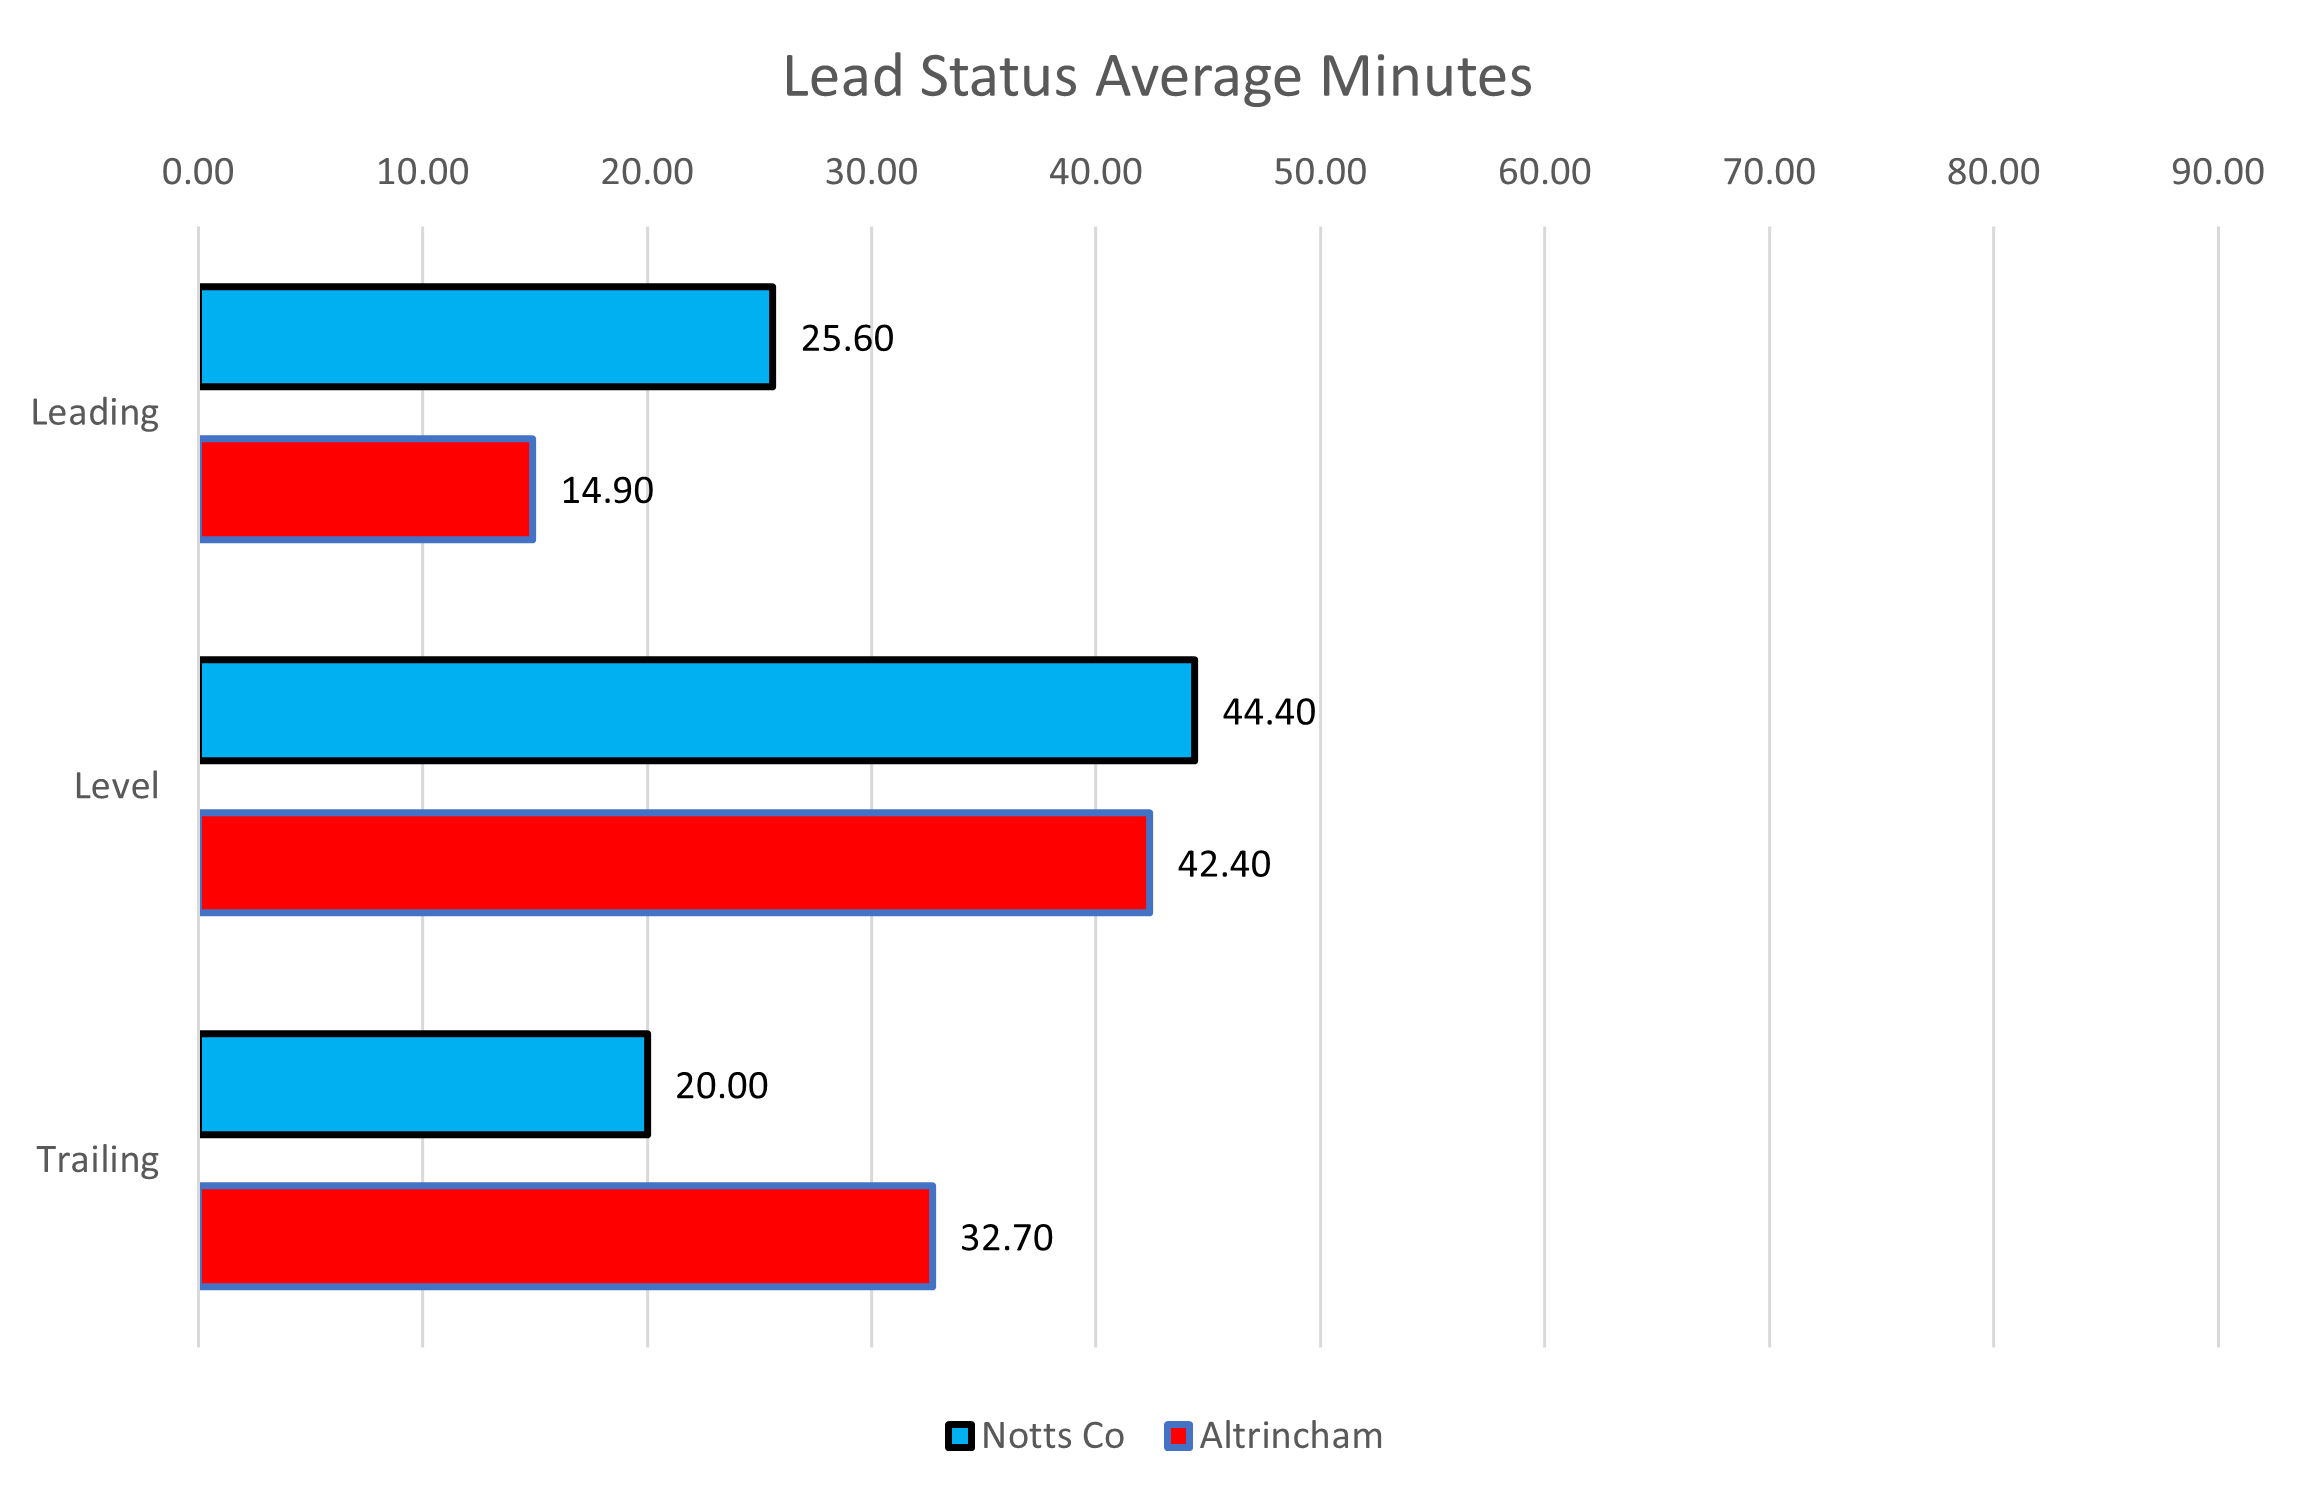
Lead status comparison.
With both teams on poor form right now the bookies currently have Notts as slight favourites where you can get around 11/8 for the away win.
You can get 11/5 on a win for the home team and circa 9/4 for the draw.
Based on these odds Notts have a 42% chance of winning and Altrincham a 36% chance of bagging the 3 points.
Based on what we've seen in recent games you would expect to see Notts start strongly again but will need to be more clinical in front of goal.
This could be an ideal opportunity for Ian Burchnall to give starts to the likes of Rodrigues and Boldewijn but that might mean a move away from the 352 formation he seems to be preferring at the moment.
Essentially the first goal will be the difference in this game, if Notts go ahead early on I'd like to think it will give them the confidence to go an and secure a comfortable win but if they concede first even a draw could be an uphill struggle.
COYP!
Richard