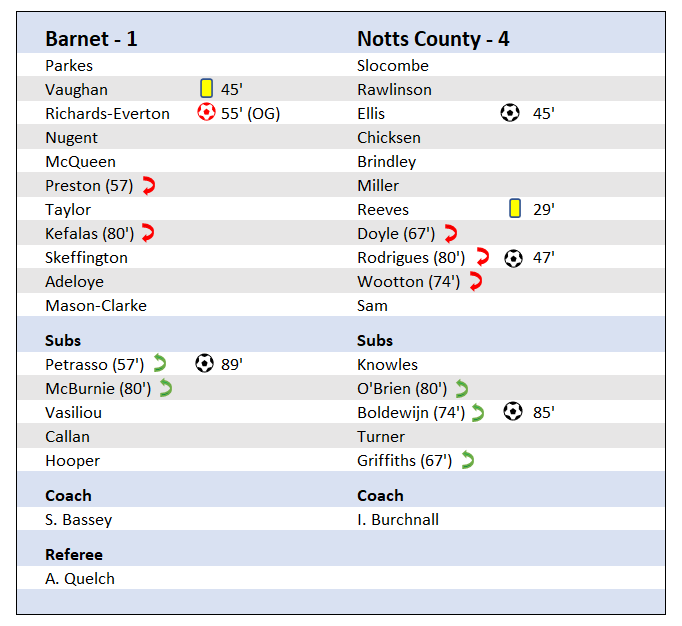
Whilst the comprehensive win at Barnet left many Notts fans looking ahead to a play off push with renewed enthusiasm, an inability from his players to impose themselves further in a game they had complete control of left Ian Burchnall contemplating what could have been.
Add to that another goal conceded late on, and from another set piece, it is difficult not to sympathise with the Head Coach's frustrations.
That said overall it has been an encouraging couple of results which sets us up nicely for what will be a very intense last 5 games of the regular season.
Onto the stats.
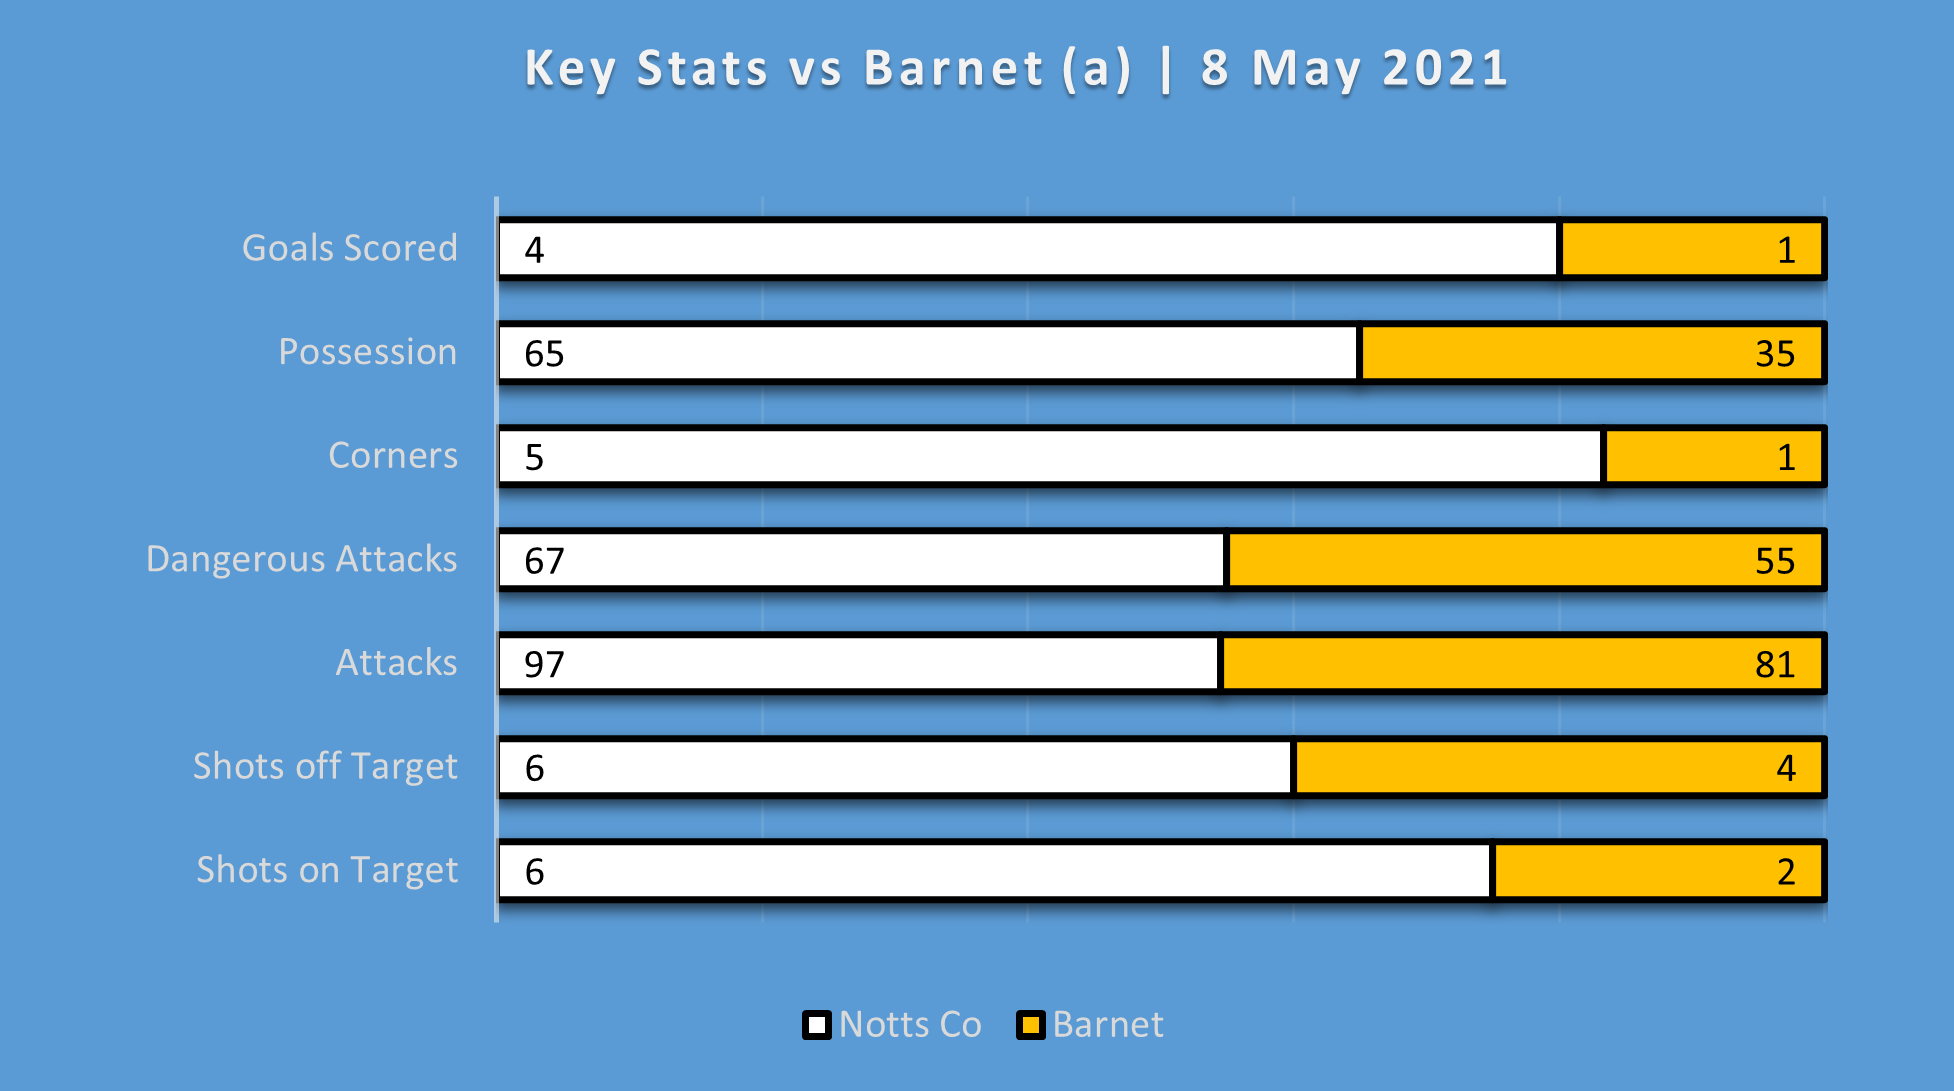
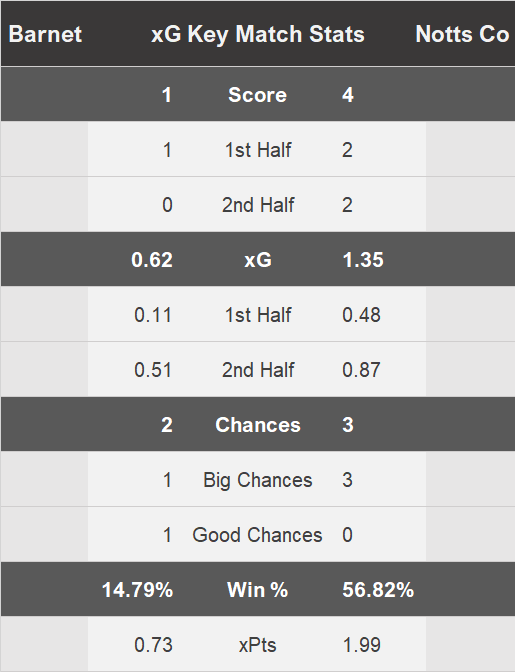
Match stats below and Notts coming out on top in all areas.
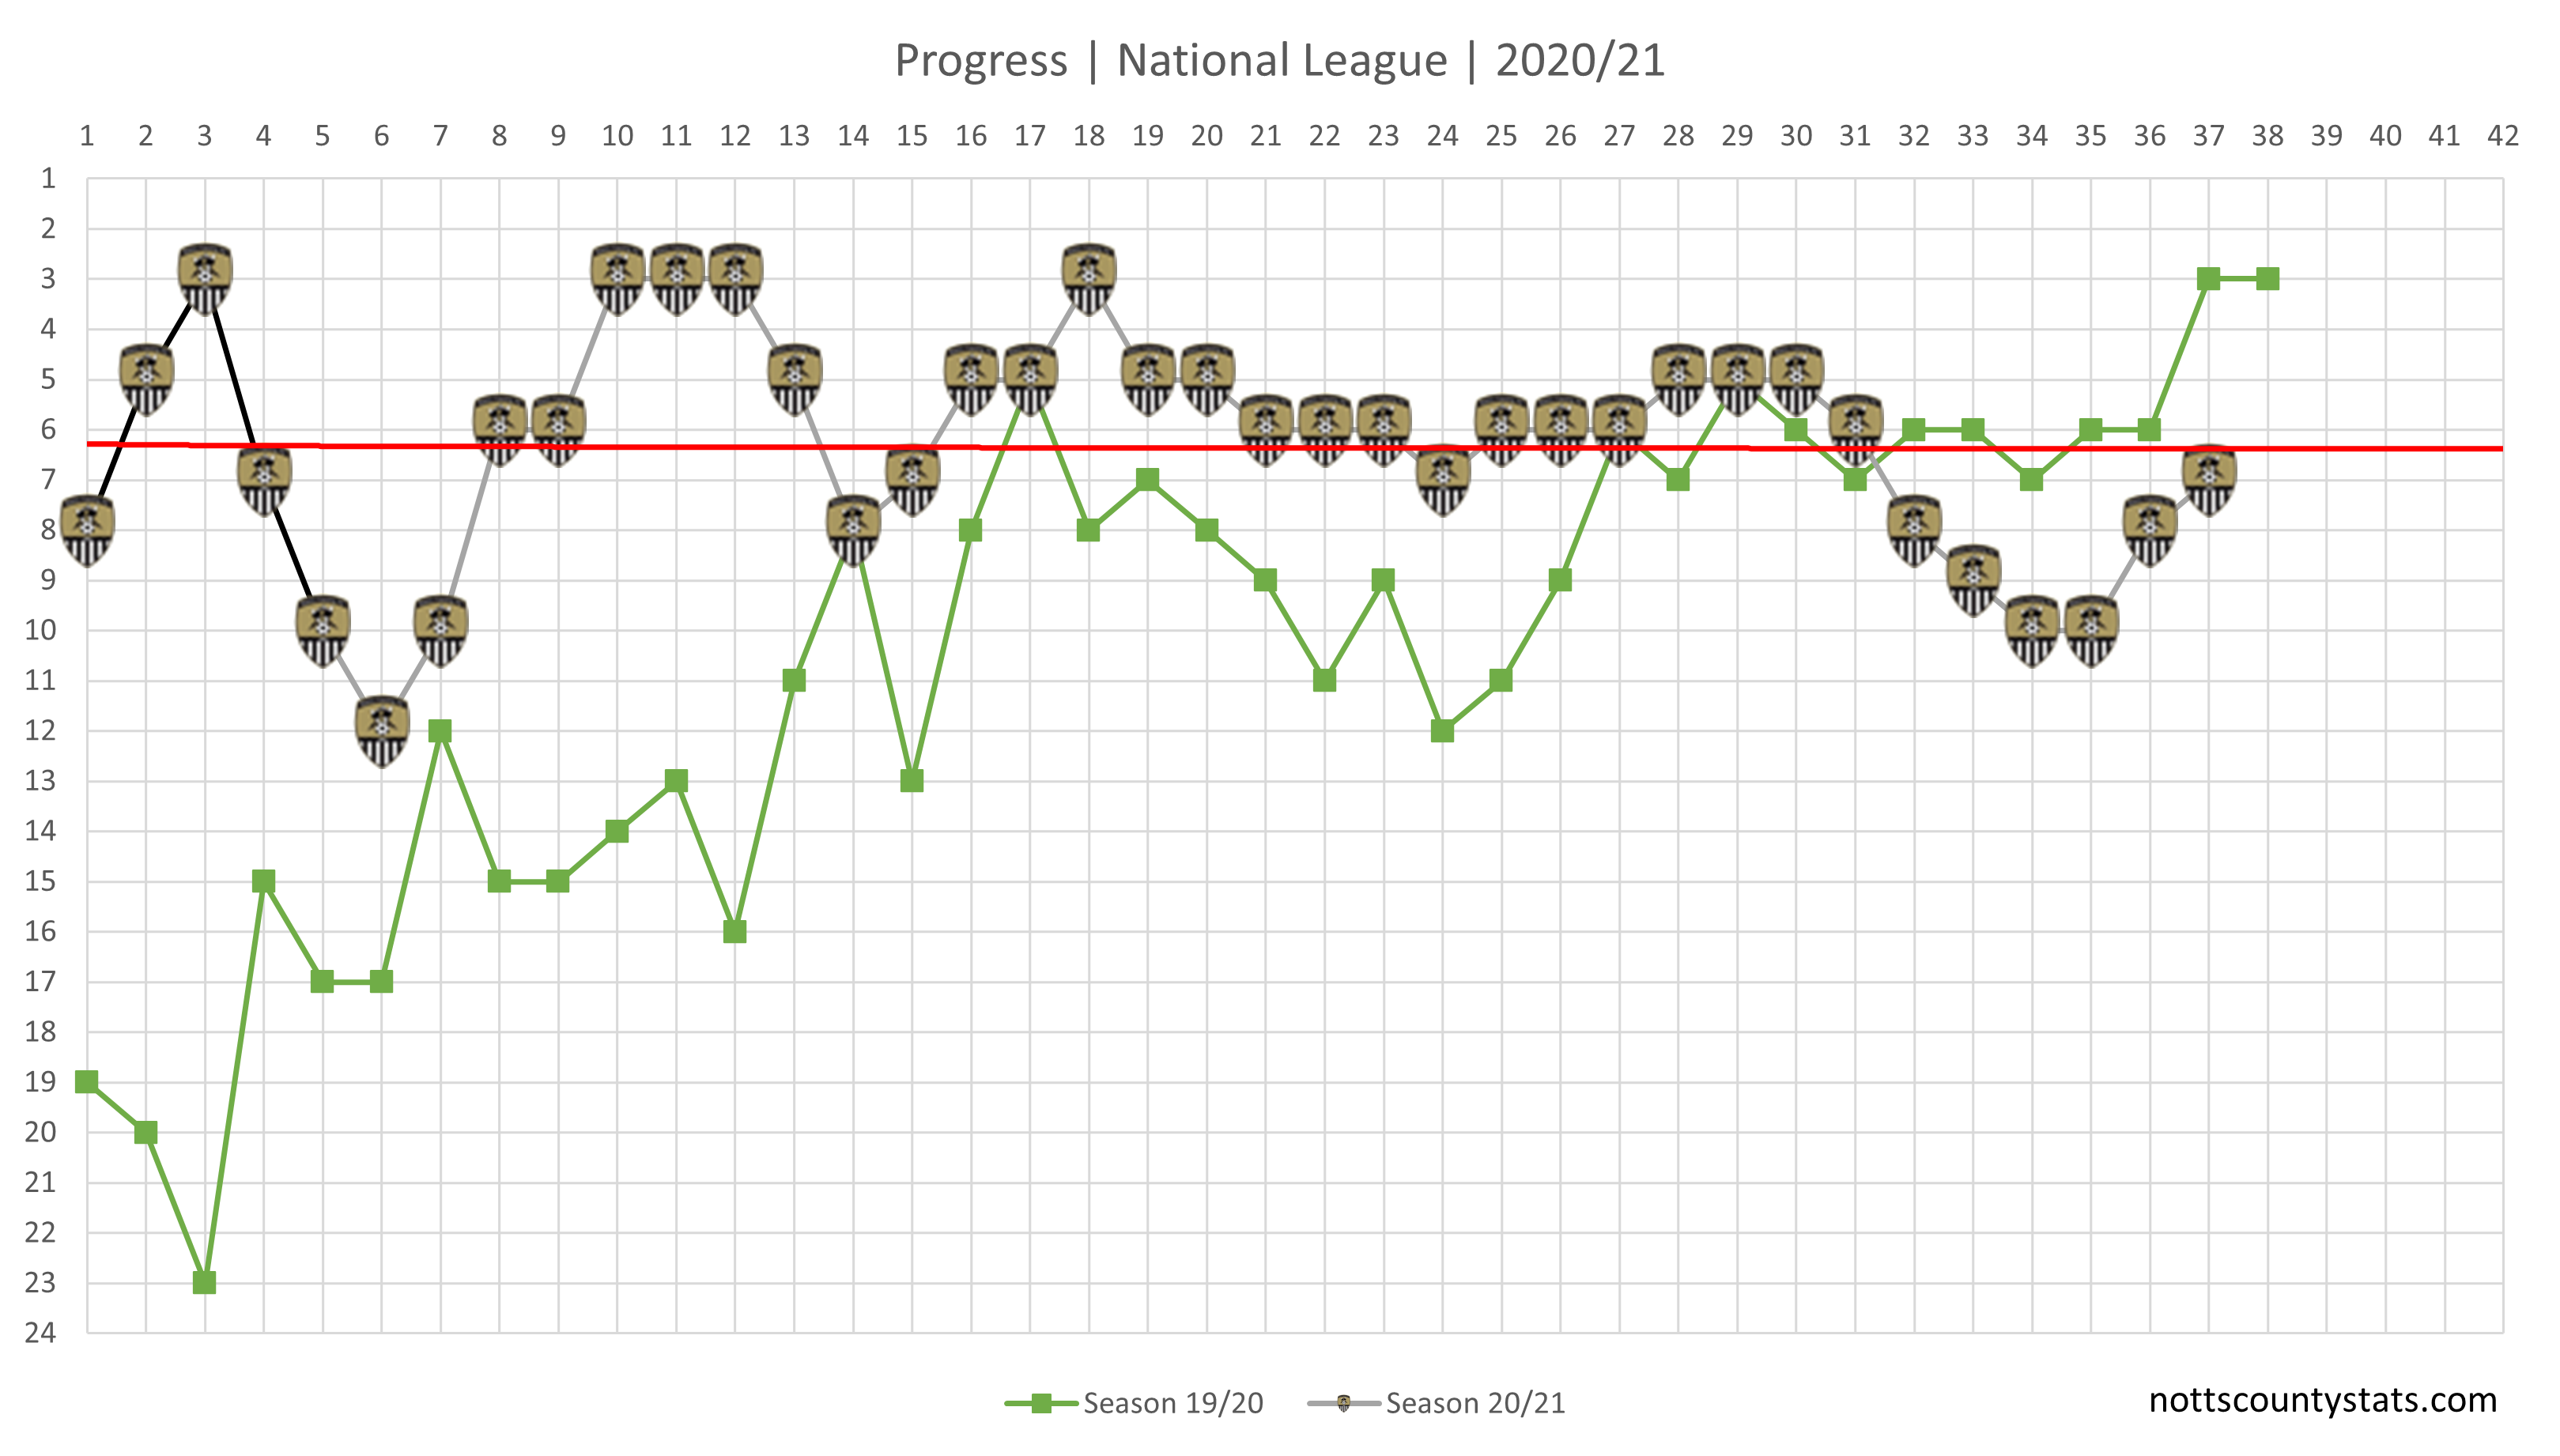
Progress updated and back in the play off places. Average position for the season has levelled out at just under 6th place.
Results tracker updated.
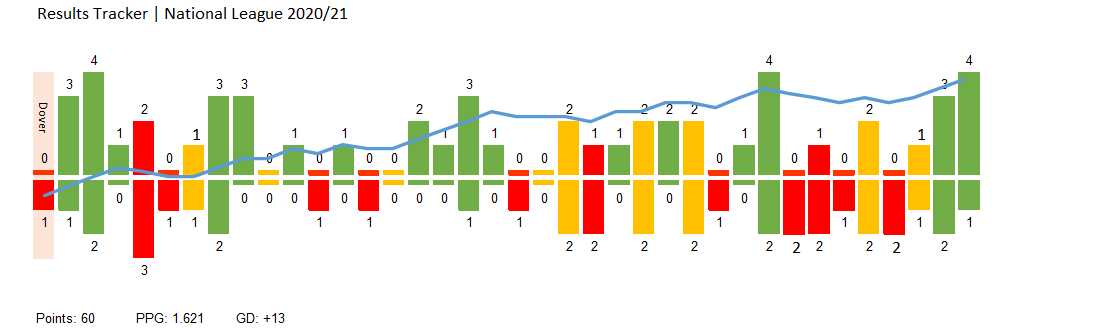
Points needed updated and another 3 points see Notts edging closer to a top 7 finish.
You can filter the chart by clicking on the legends at the top.
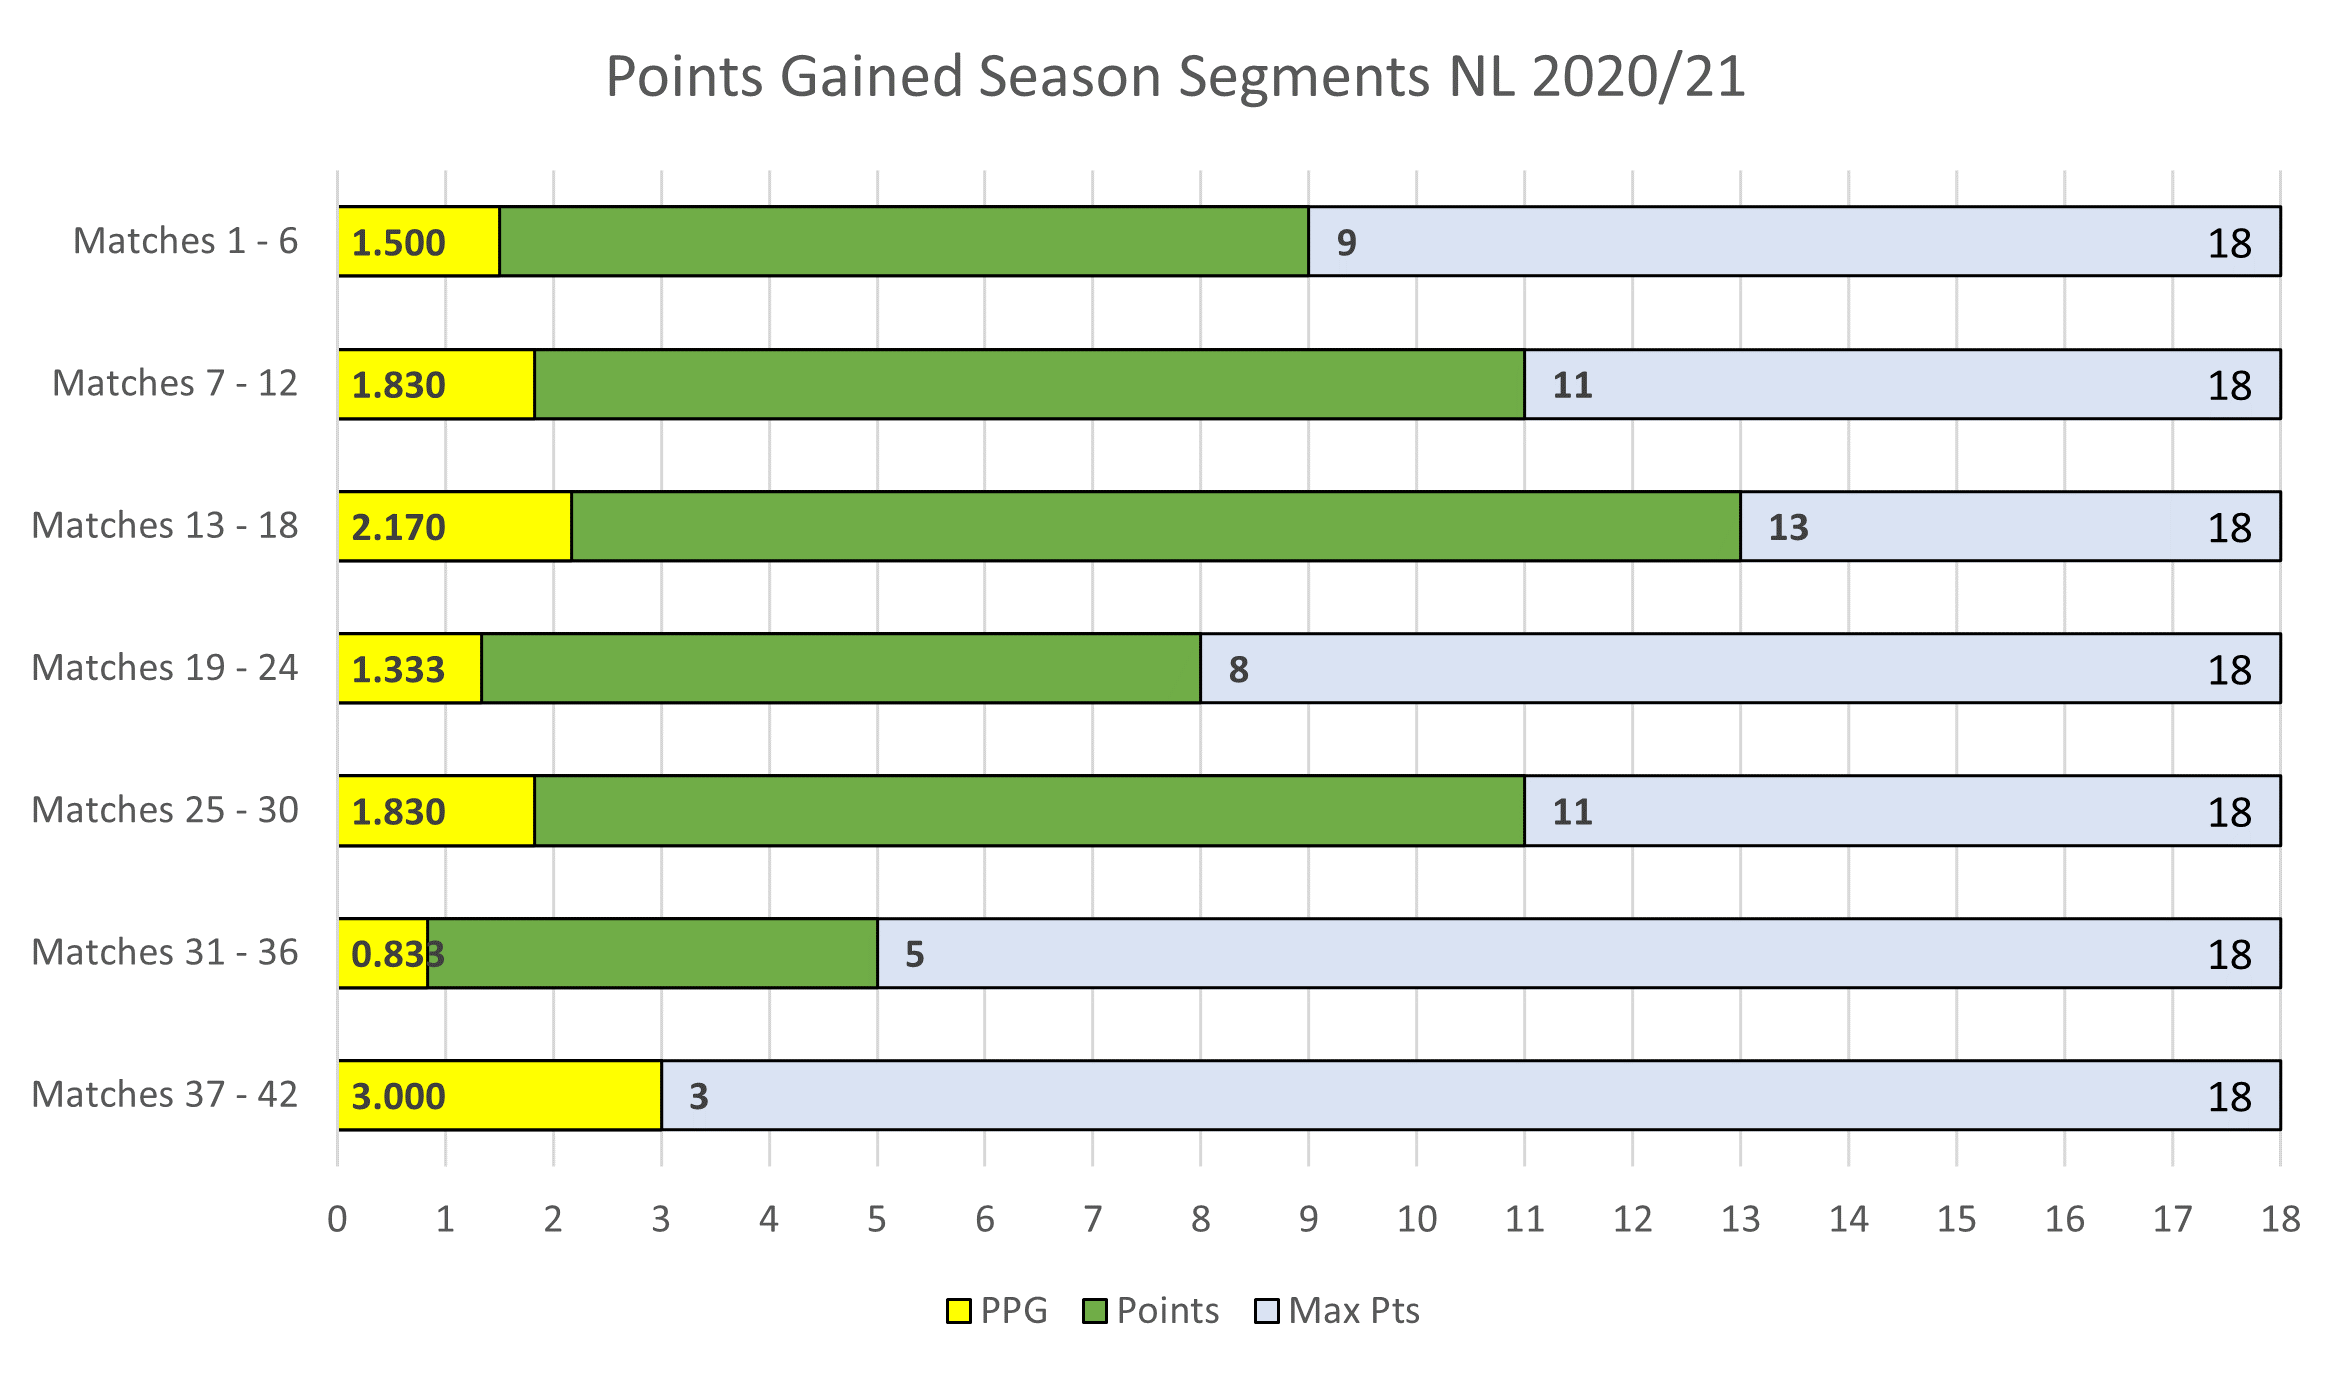
League segment chart updated. Grey bar shows total points available for that segment. Green bar shows total points gained and yellow bar the PPG for that segment.
First of this 6 game segment.
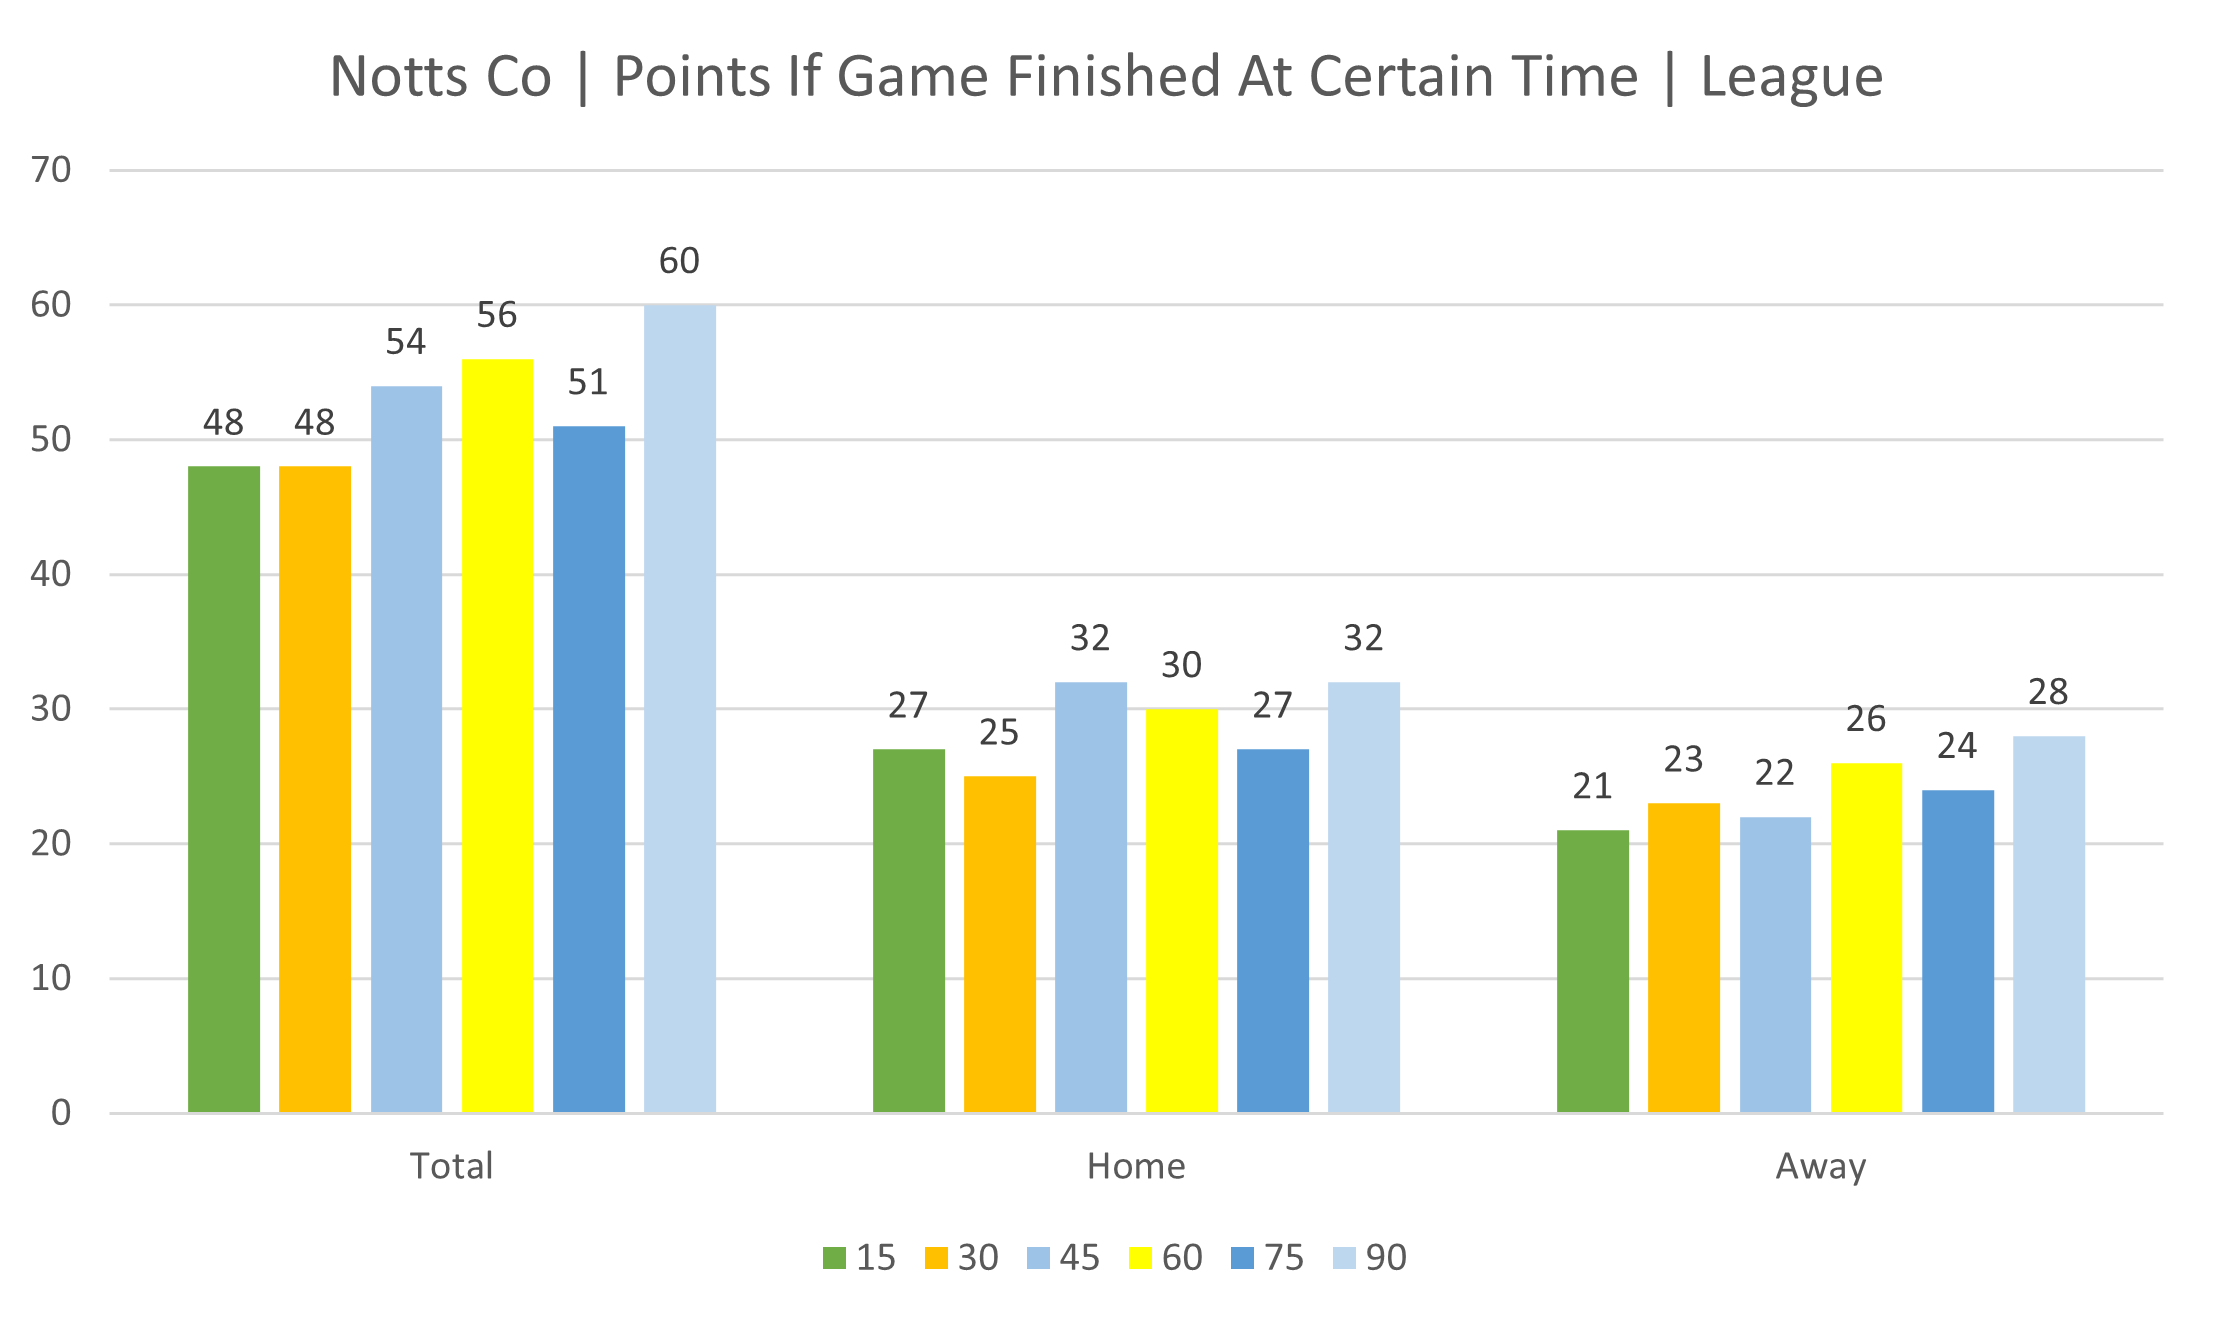
Points by time segment. How many points would have been accumulated if games had finished at 15, 30, 45, 60, 75 and 90 minutes.
Onto player stats now and remember you can find all the player stats on the website here.
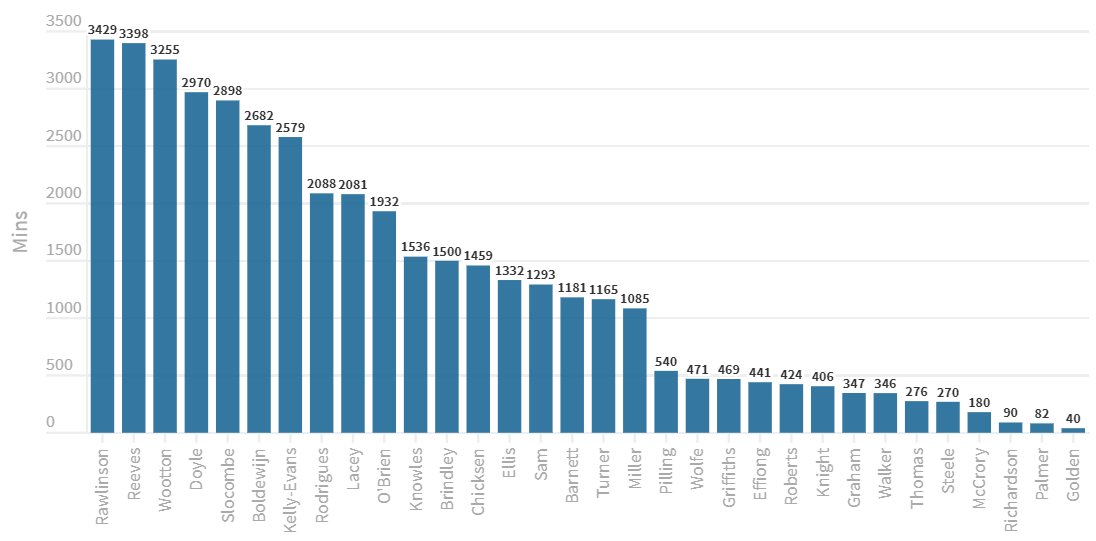
Minutes played updated: Rawlinson, Reeves and Wootton all well into the 3,000's now.
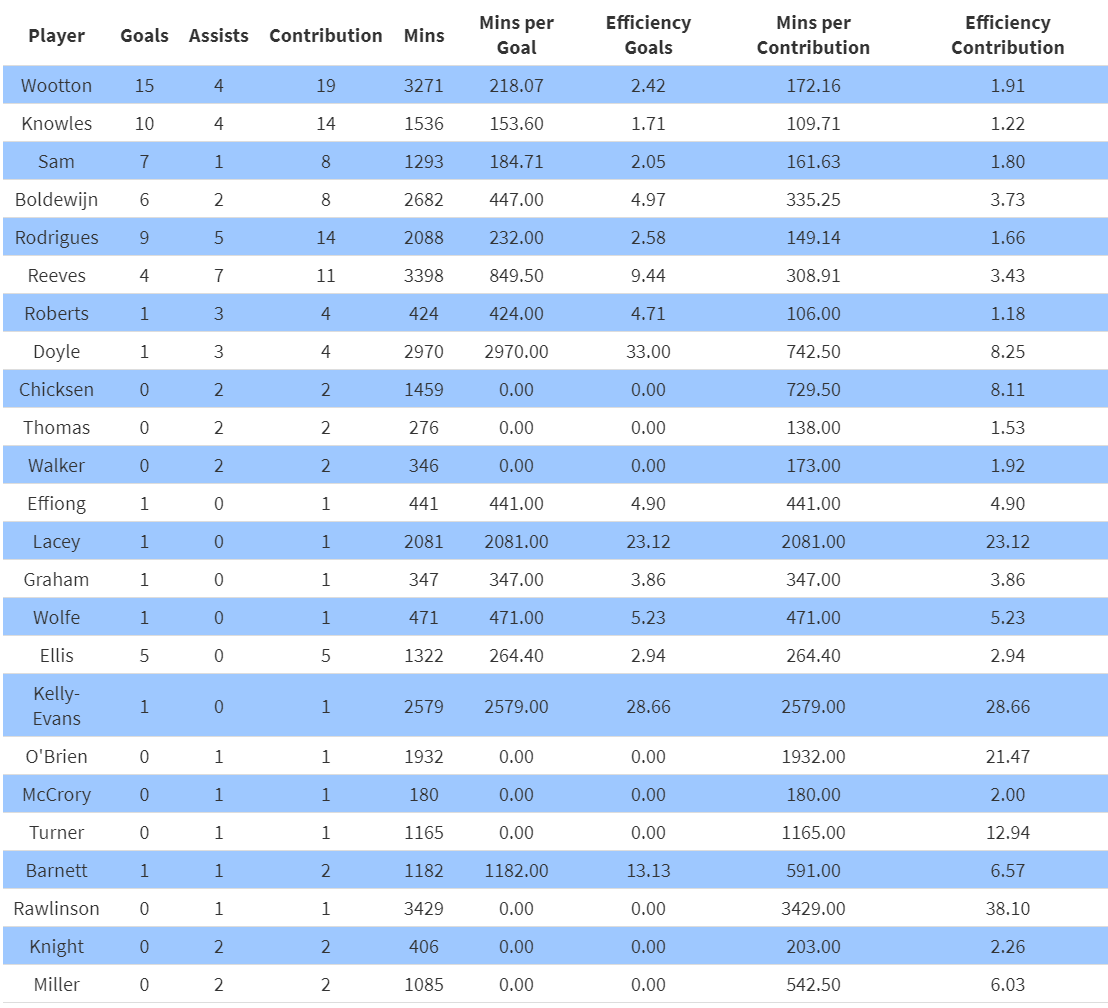
Goal contribution table updated. Again, you can find this on the website and sort columns etc.
Goals scatter chart updated.
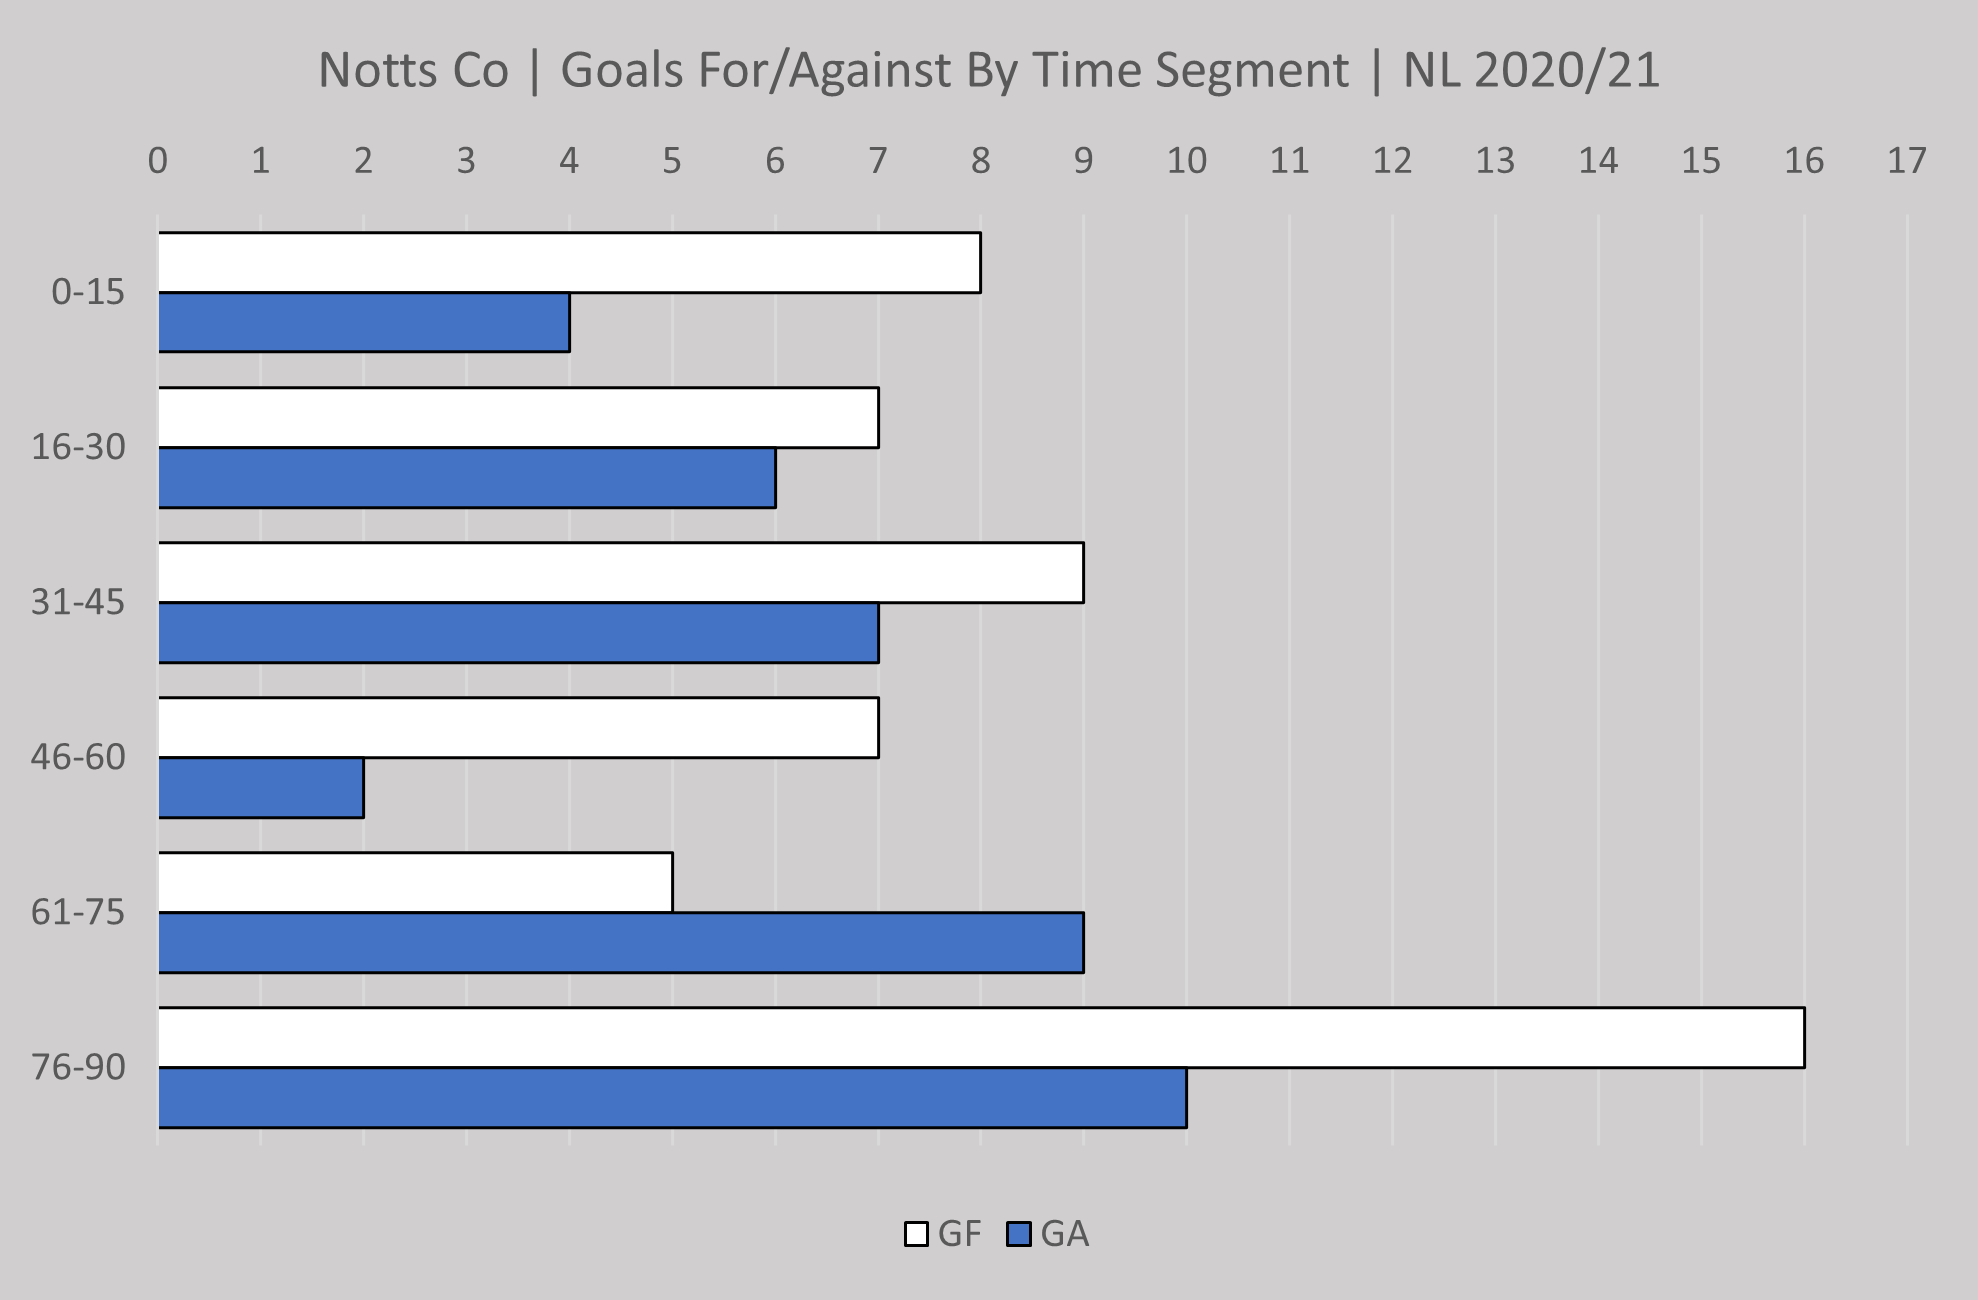
Goals by time segment updated.
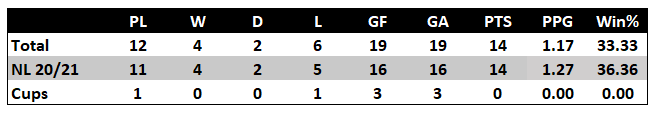
Ian Burchnall's record updated after 12 games in charge.
Onto xG now and before we look at the data for the Barnet game here's a quick look at how Ian Burchnall's 11 games look when you compare actual results to expected results.
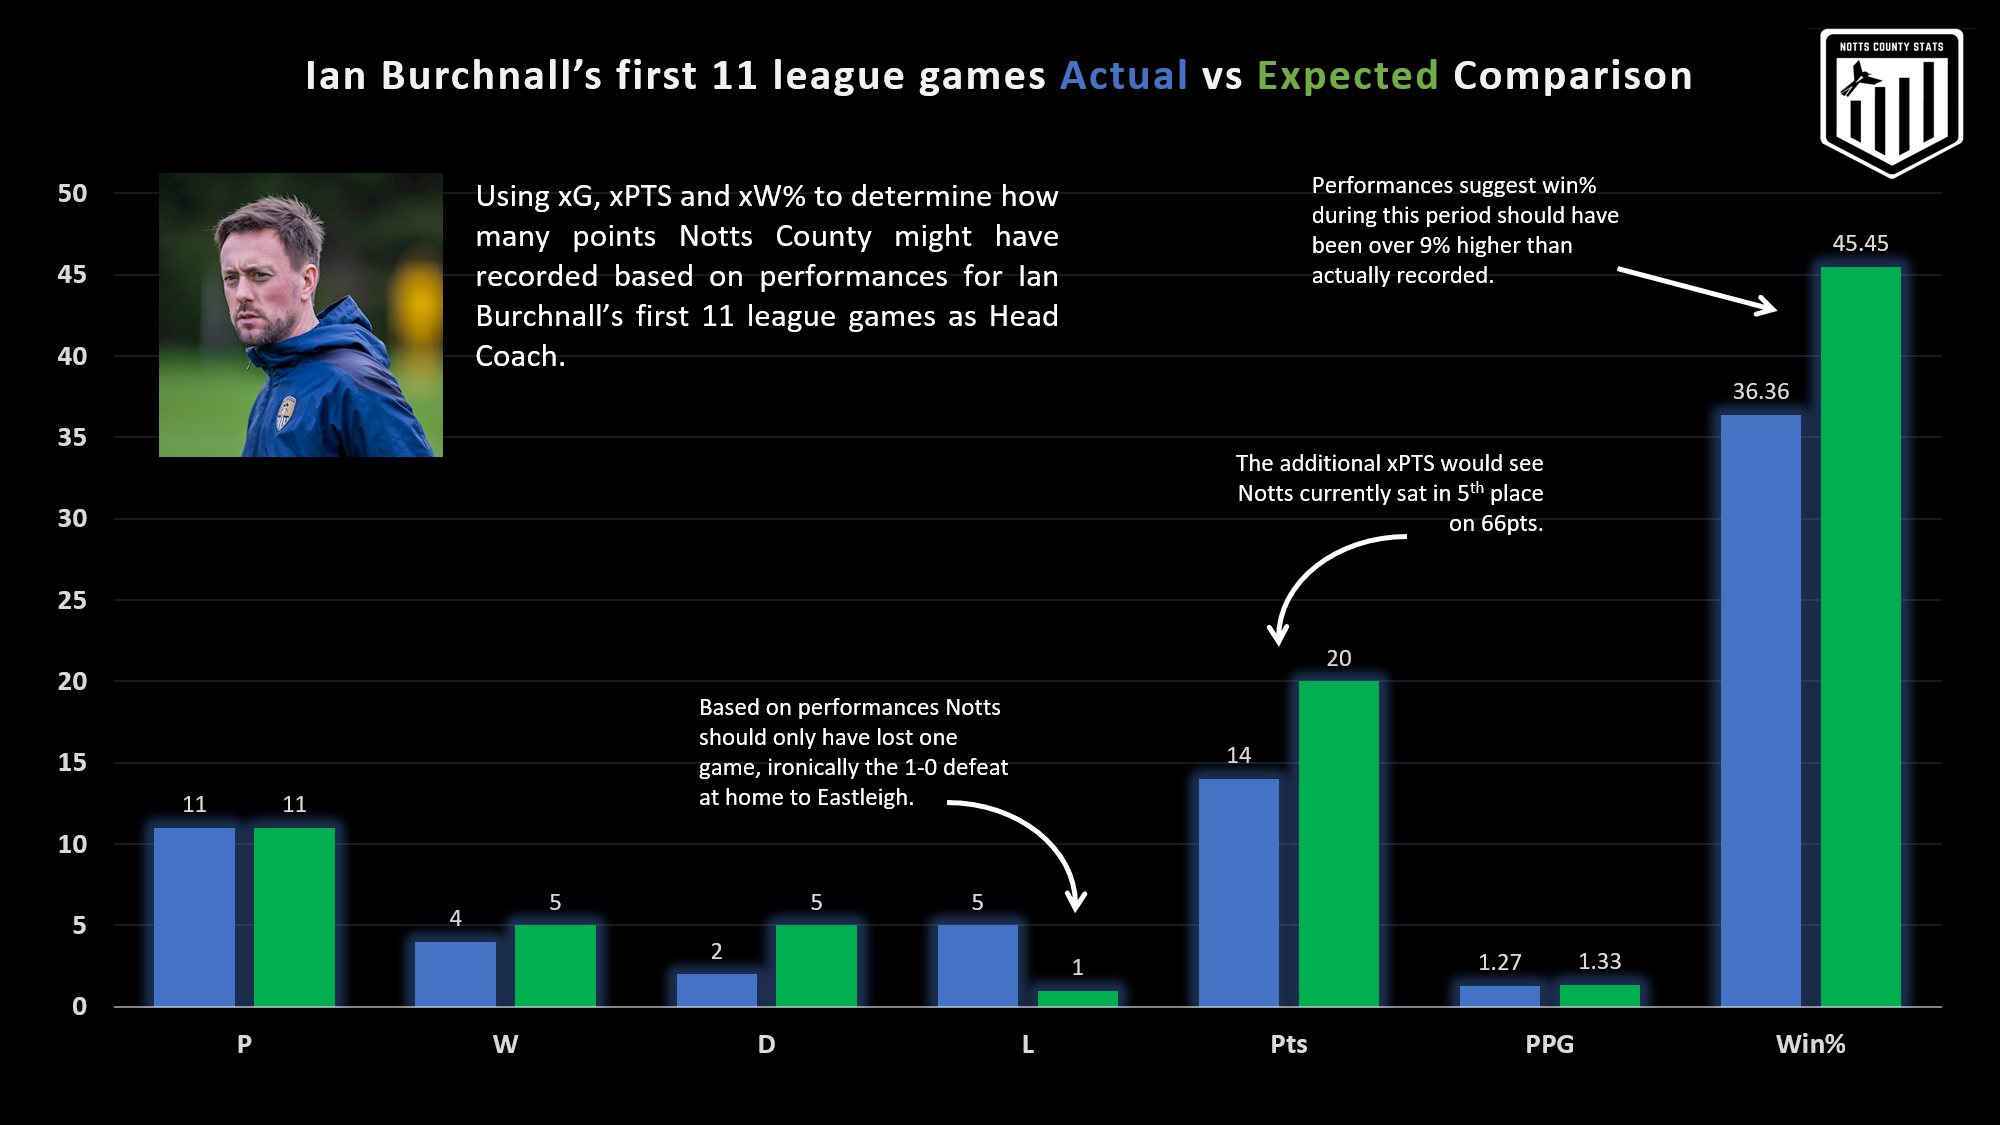
This visual raised a few questions when posted on social media over the weekend so to try and clarify things the whole idea of this comparison was to try and explain how performances can often not reap the rewards they deserve and vice versa.
Expected data e.g. xG (expected goals) and xGA (expected goals against) are quantitative measures for events that take place during a game. For example a goal attempt either results in a goal or no goal. A quantitative measure is applied to the attempt and a value applied. By the end of the game there will be a total xG value and an actual goal value.
A team may have drawn a game 0-0 but have a much higher xG value than their opponents due to creating more big chances, so in theory should have won the game.
Additional values can then be calculated to provide an expected points value (xPTS), possession value (PV) and a win%. These values can then be used to determine what is often referred to as a fair score.
The data visualised above is essentially a fair score assessment of the 11 games analysed and suggests that had results gone as expected Notts would have more points on the board than they actually have.
This would suggest that Notts either didn't make the most of the chances they created during that period or maybe didn't have the rub of the green.
Essentially "expected" events in a game form an integral part of football performance analysis.
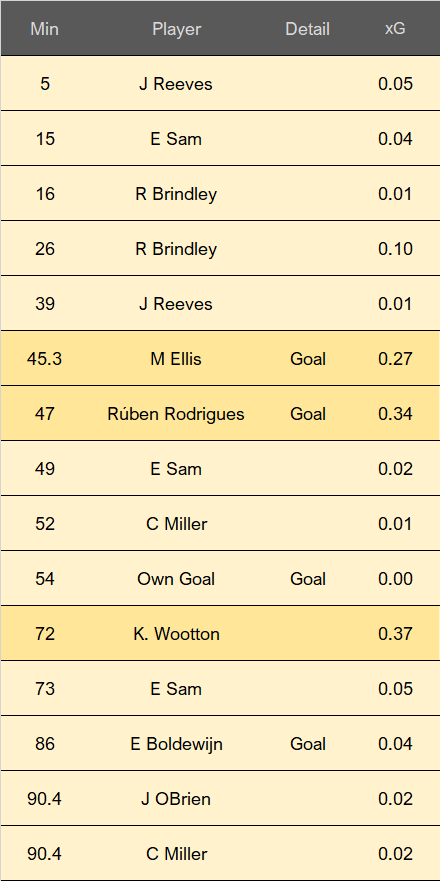
Anyway, onto the Barnet game and I don't think there is any argument regarding who should have won this game. Barnet actually had a period of 54 minutes without an attempt on goal.
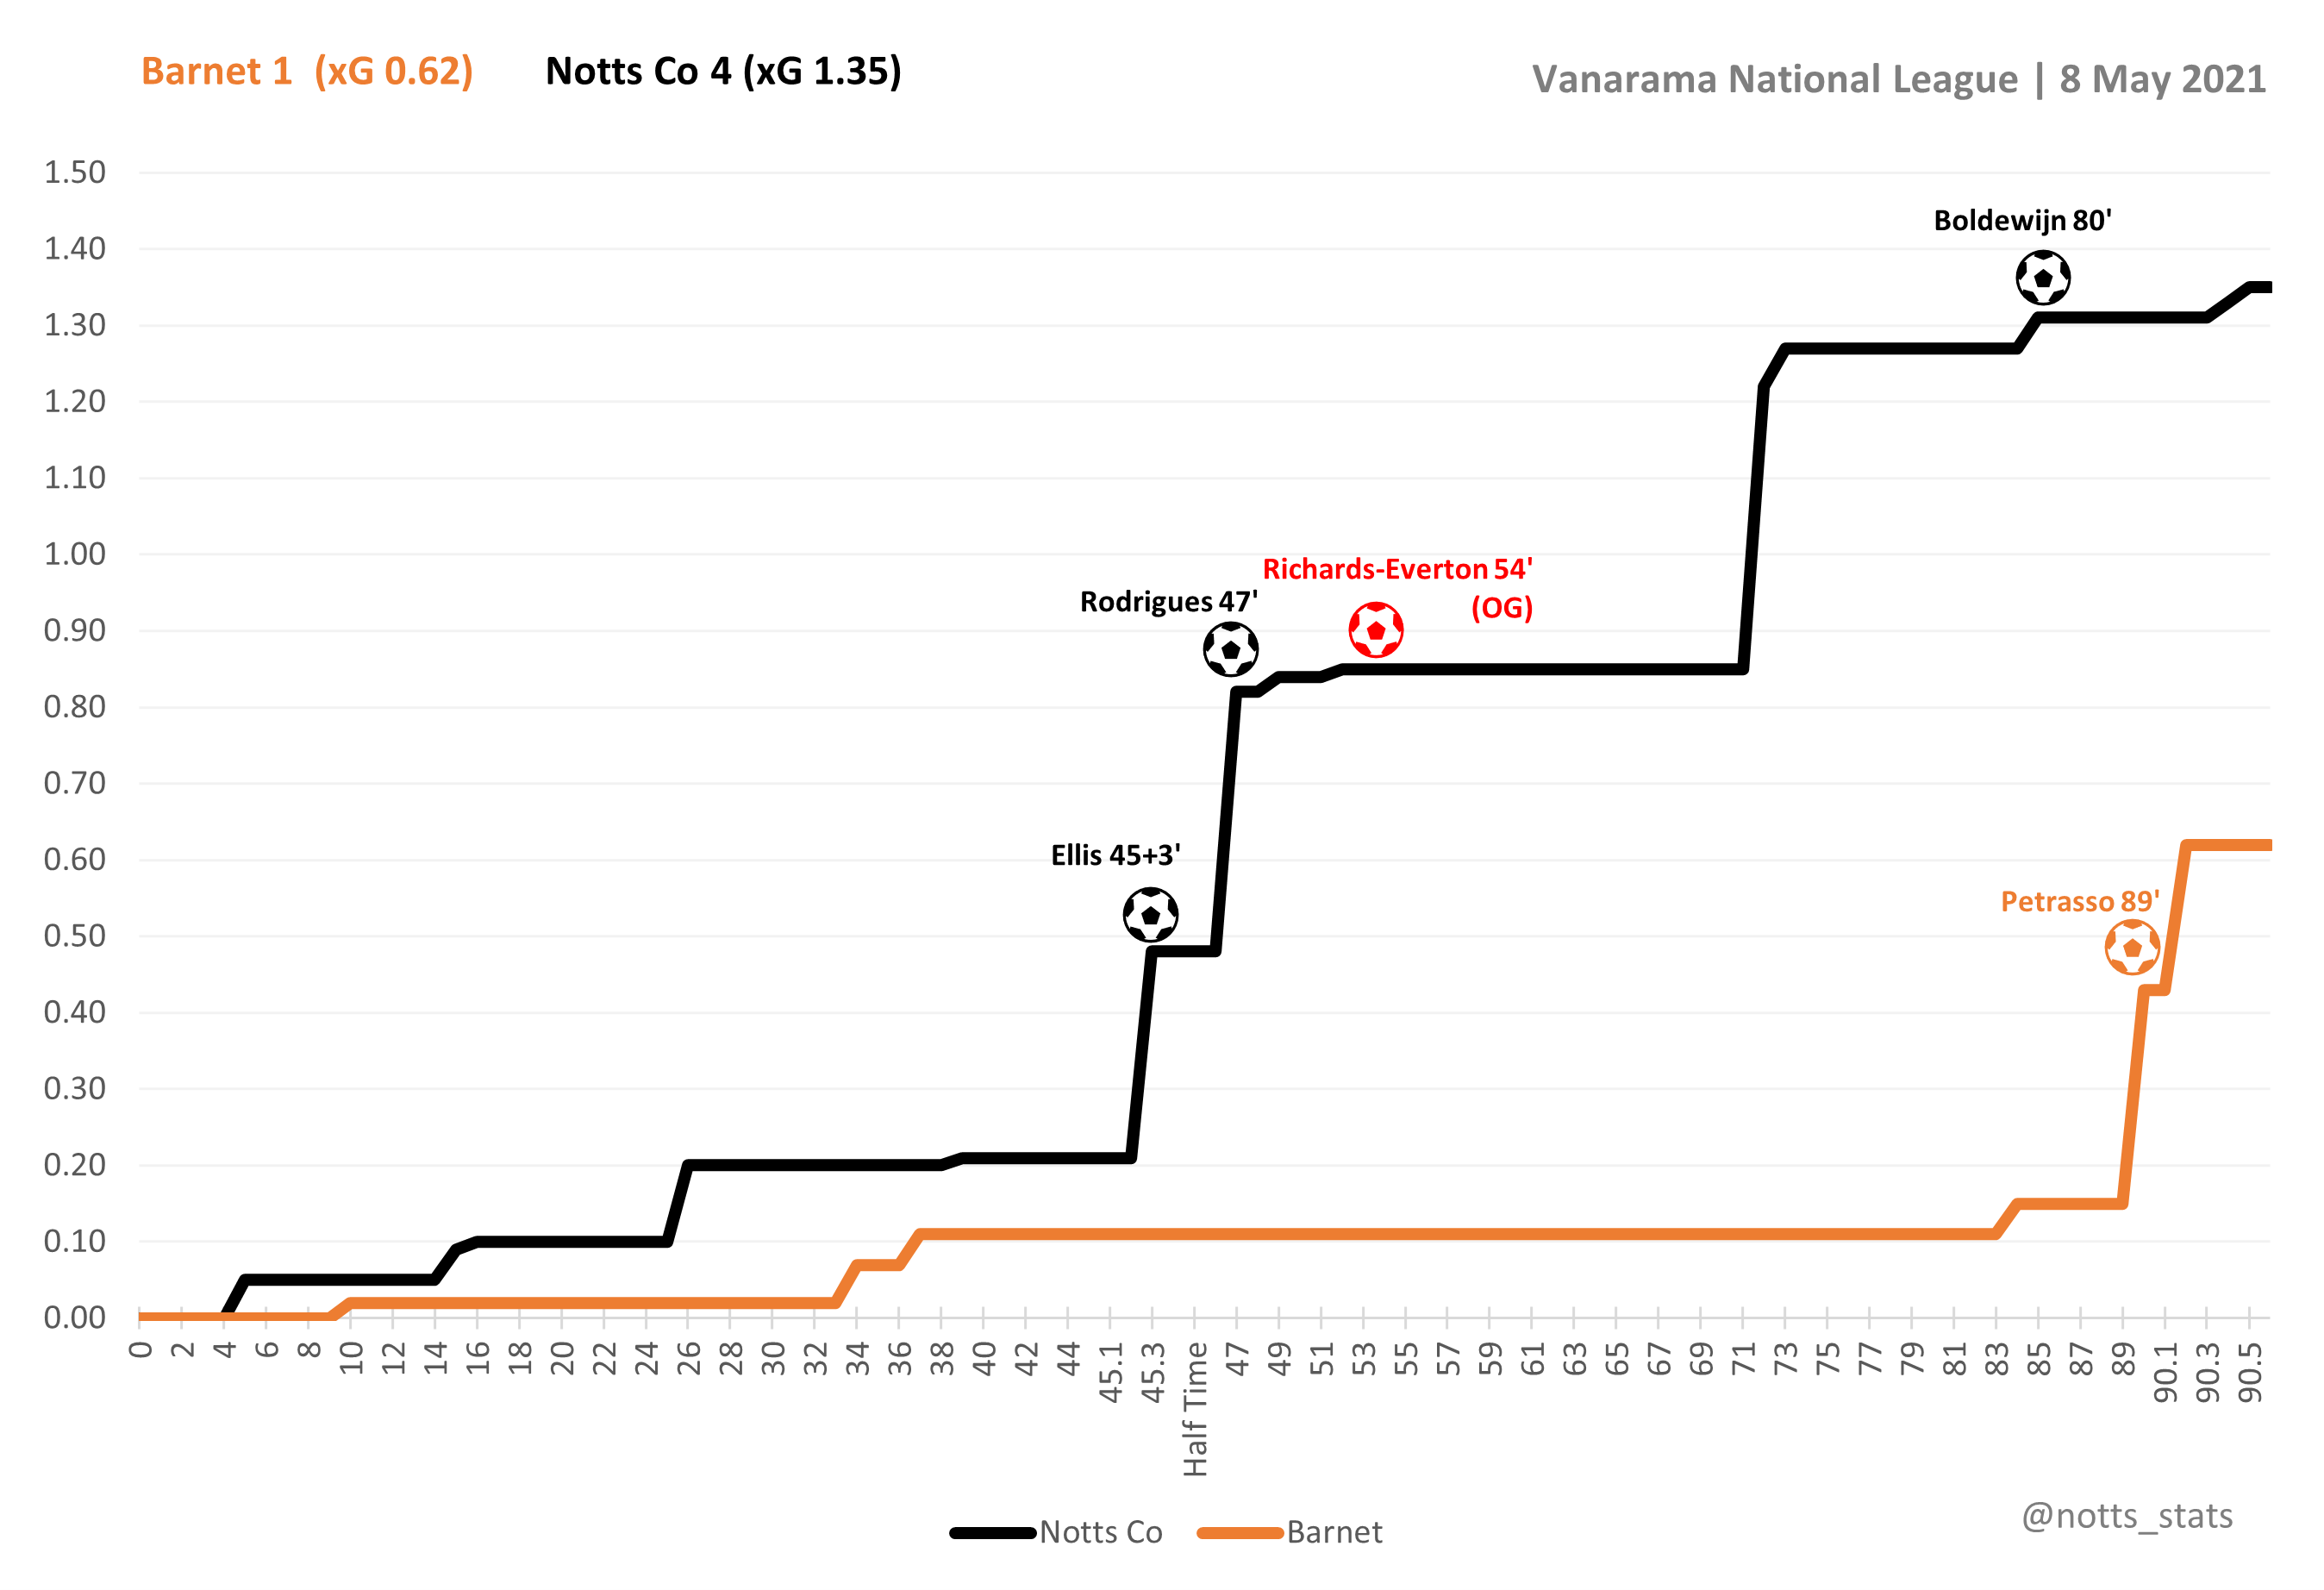
xG key match stats and a game in which a draw would clearly have been a fair result. The penalty is added here for context and how it impacted on xPTS.
Player xG for the Barnet game.
Preview | Maidenhead Utd (a) | Vanarama National League | 19:45
Tuesday 11th May 2021 | York Road
Notts travel to York Road looking for a third consecutive win to help reinforce their play off credential's. As always, it's not likely to be an easy night for the Magpies . . . from Nottingham.
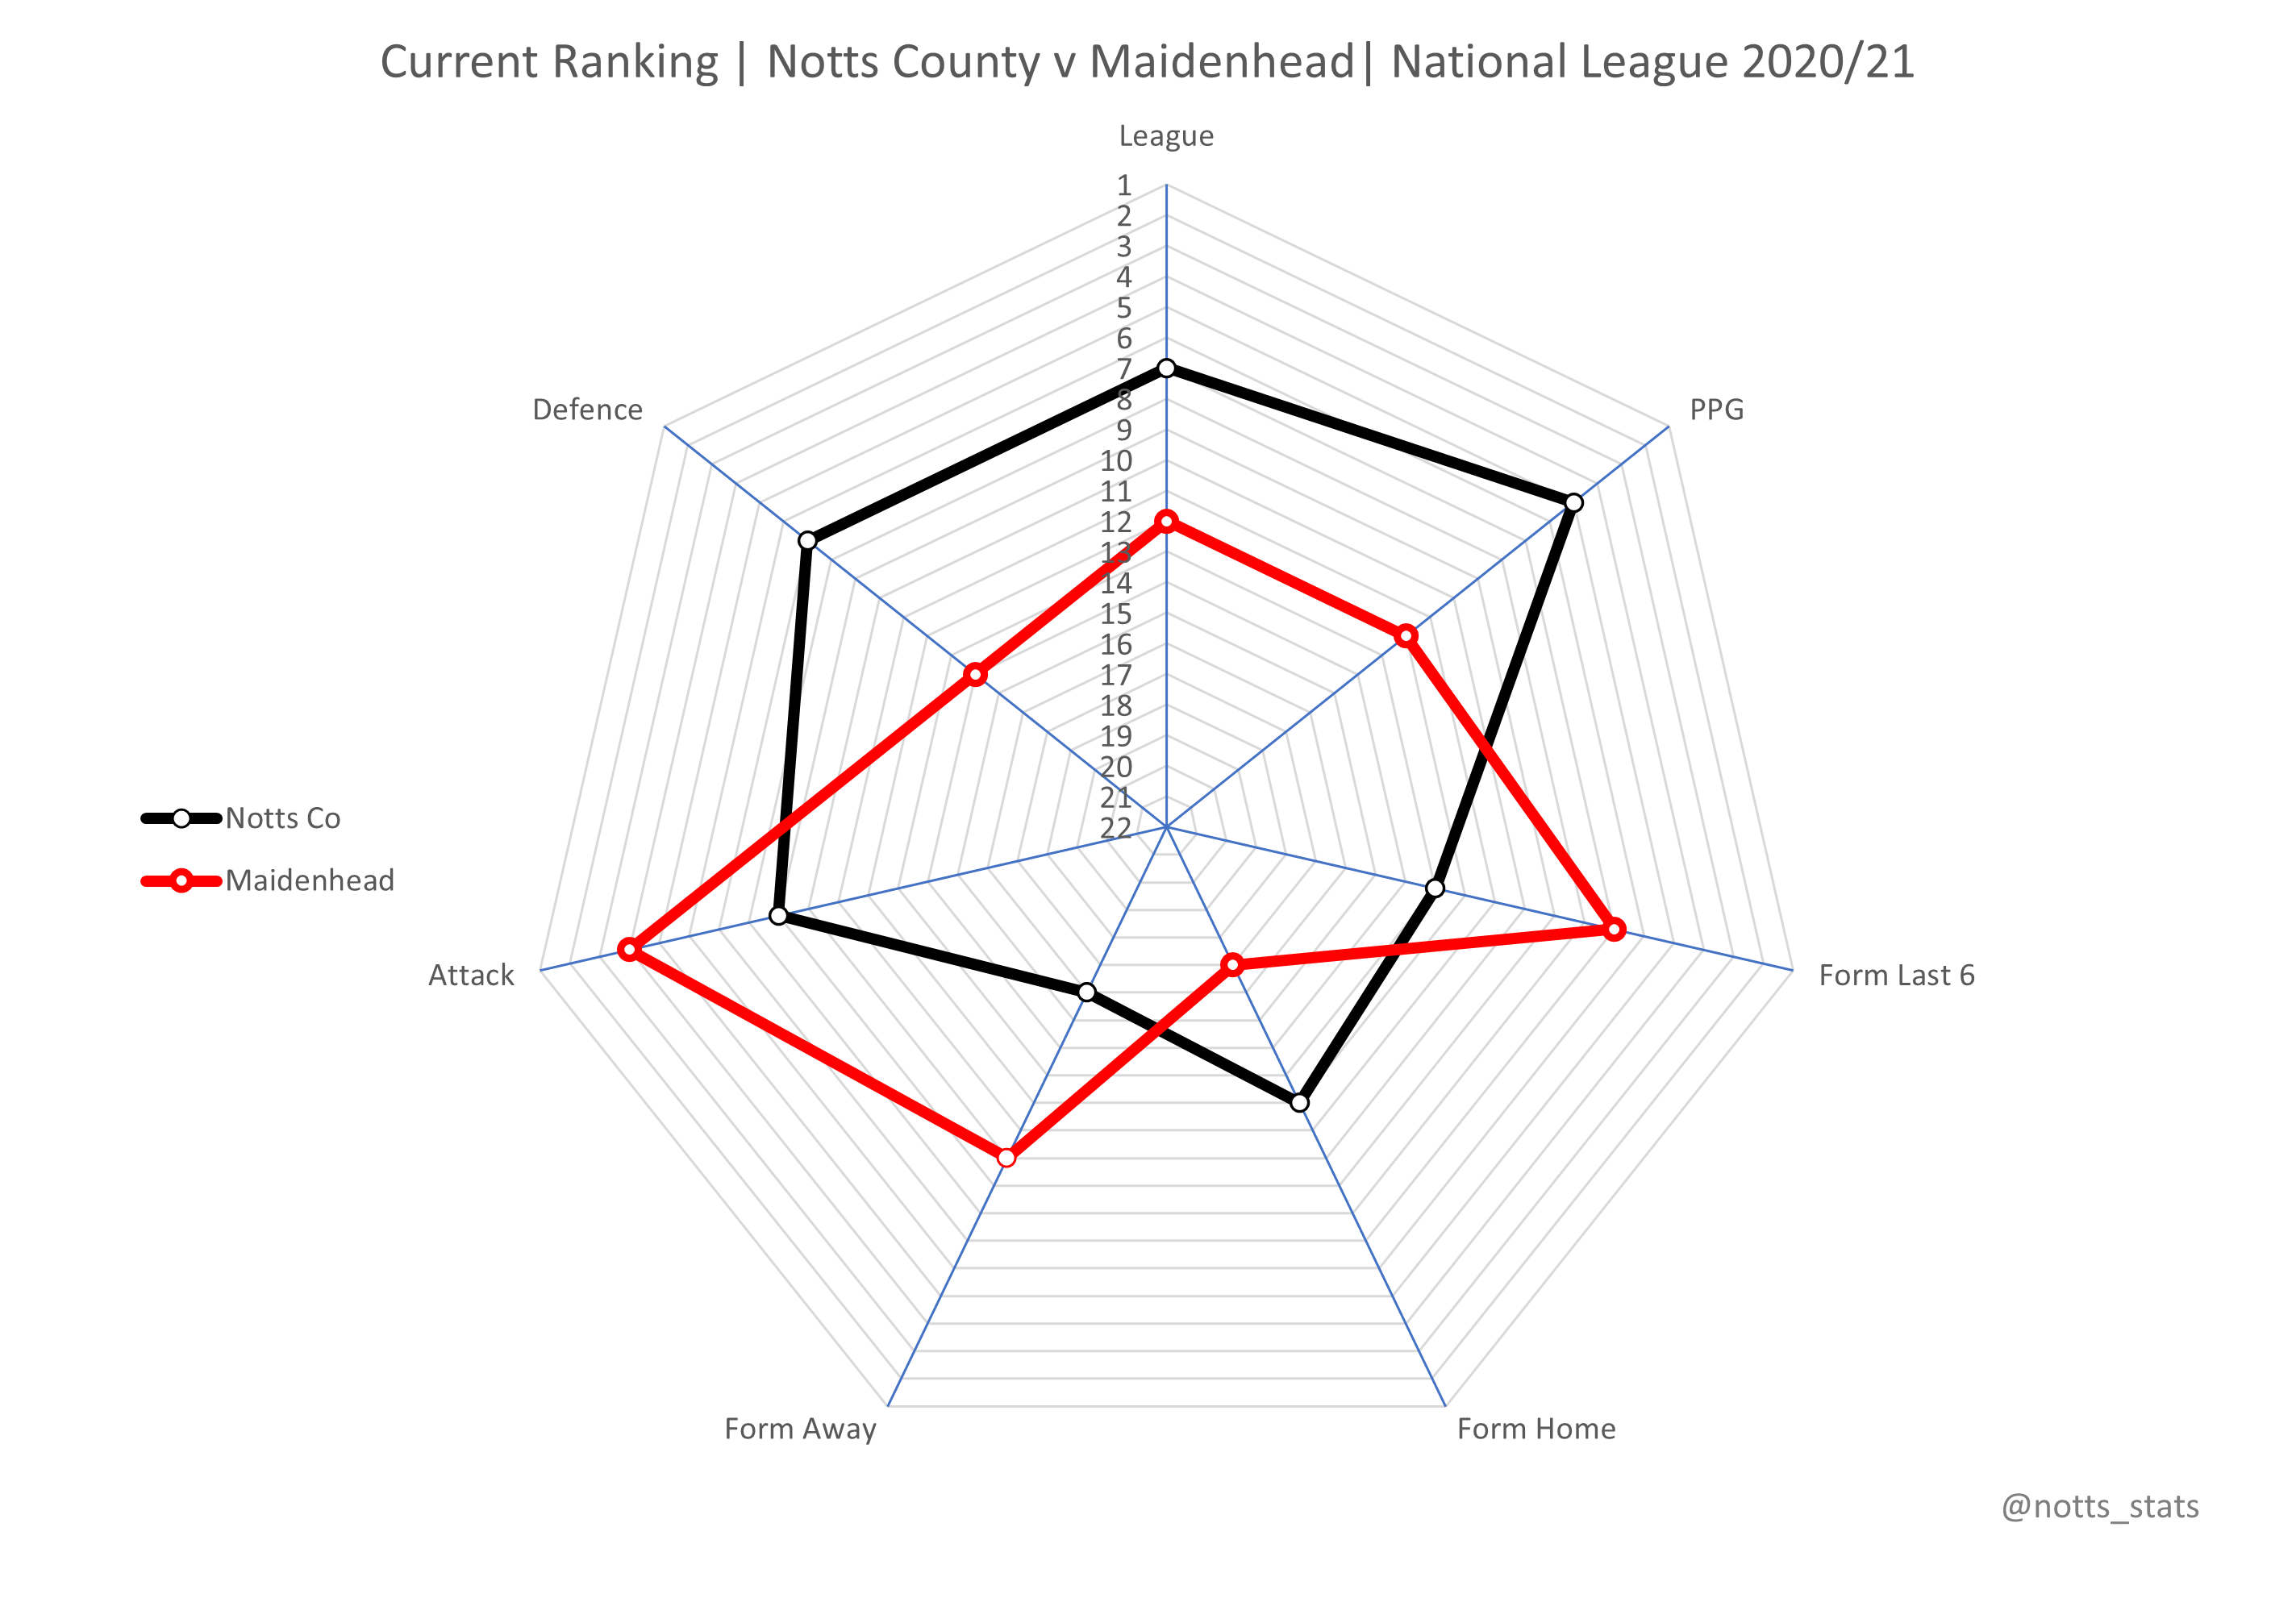
Current form radar below and Maidenhead have better recent form and attack. However, they have conceded 10 more goals than Notts and their recent home form has not been the best with just 1 win in the last 6 home games.
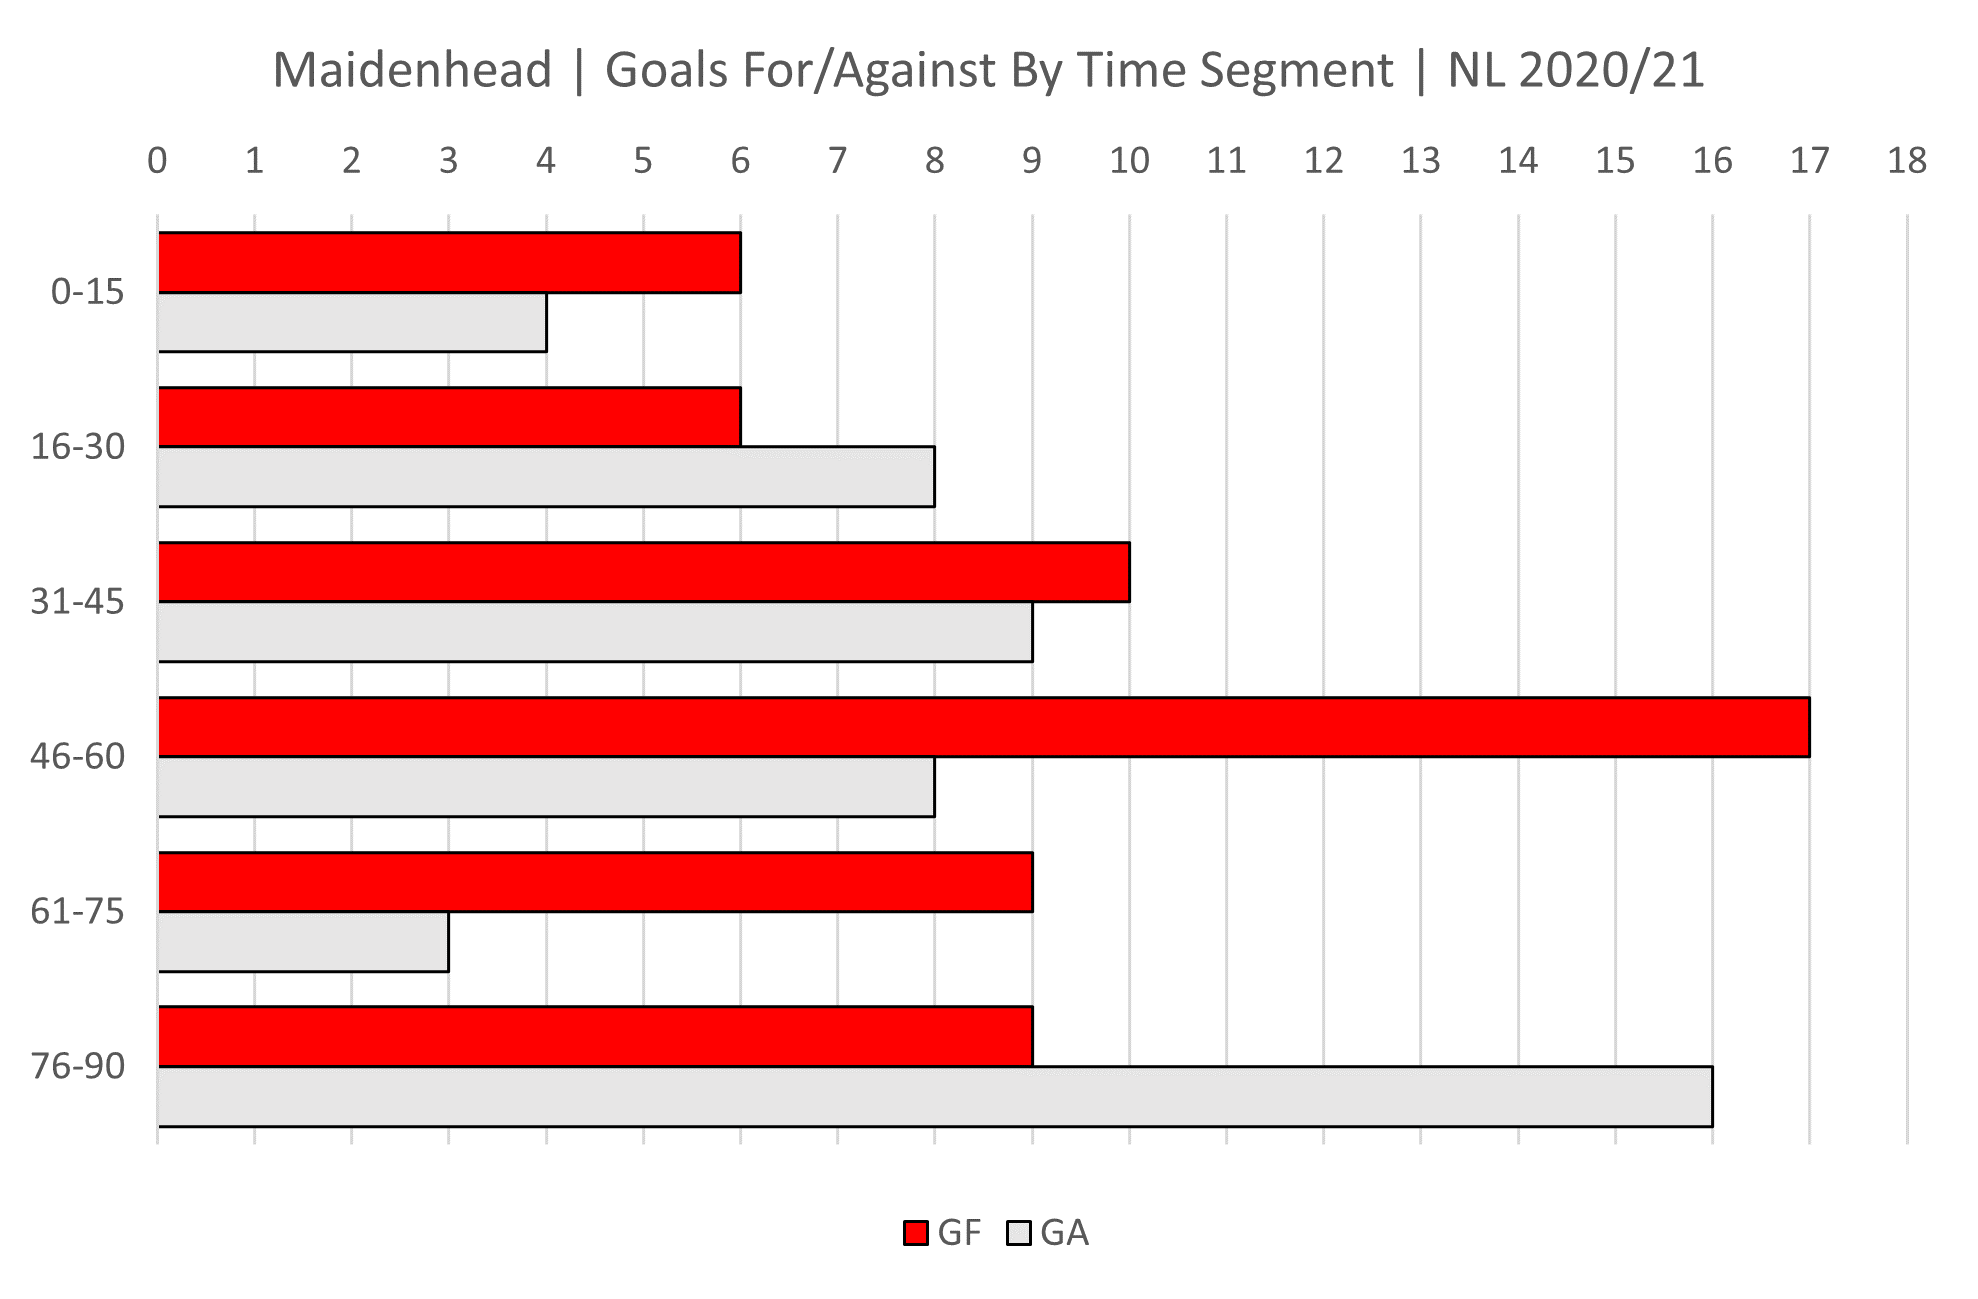
Goals for/against by time segment for Maidenhead and it looks like the beginning and end of the second half is usually pretty lively when they are playing.
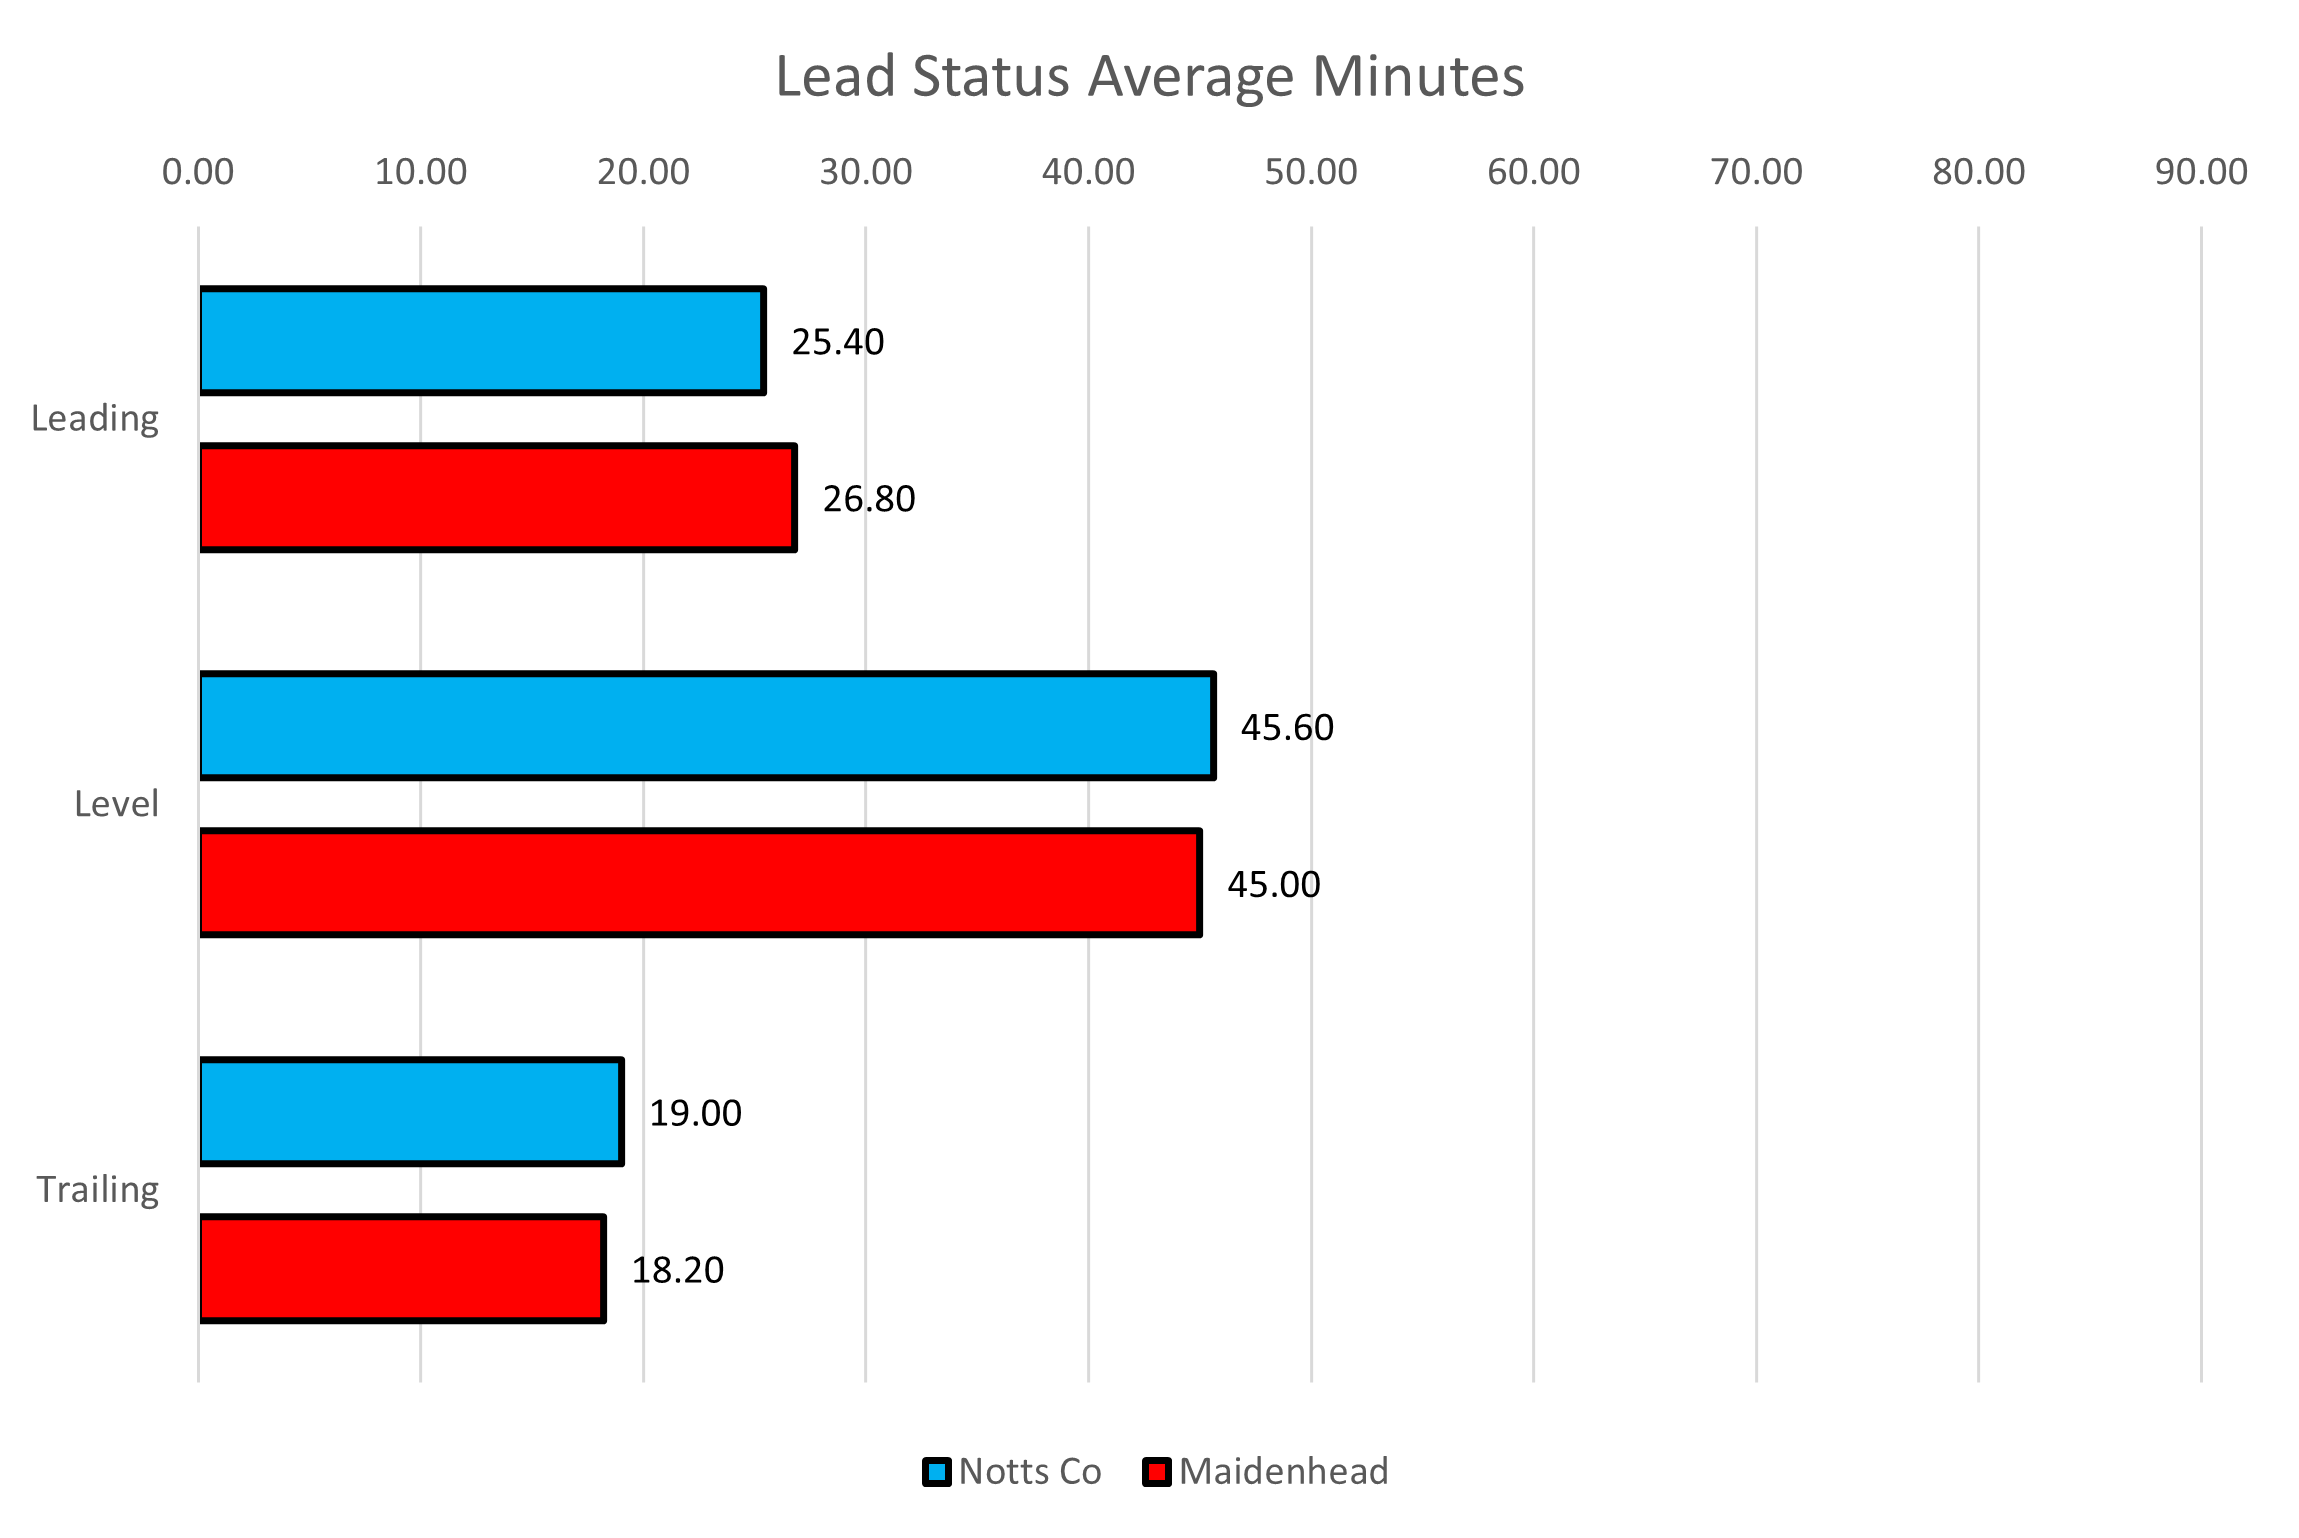
Lead status comparison, not much to separate the two teams here.
It's honours even between Notts and Maidenhead in the matches played to date with one win each and a goalless draw.
Bookies have Notts as slight favourites and you'll be lucky to get evens.
Maidenhead are coming in around 5/2 for the home win and it's about the same for the draw.
Based on these odds Notts have a 50% chance of winning and Maidenhead a 29% chance of victory.
Depending on what happens elsewhere a win will see Notts leapfrog Wrexham and Halifax into 5th place. Defeat could see a drop down to 9th.
It will be the Magpies of Maidenhead playing in black and white for this one and a win for the home team would provide a boost to their play off hopes having played less games than anyone else in the chasing pack.
I'll provide some more detail on the final stages of the promotion/play off chase in the next report.
Details for the match stream can be found here and will cost you £10.
COYP!
Richard