FC Halifax Town - 1
Allen 90' (+4')
Notts County - 1
Sam 6'
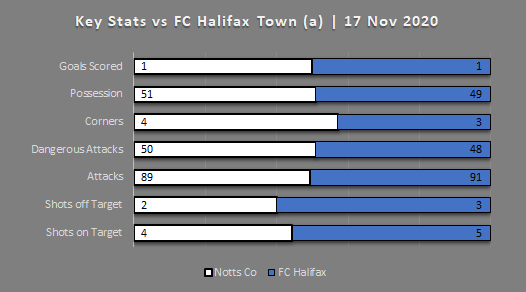
It may seem like 2 points lost at The Shay last night following Jamie Allen's sickening late equaliser for the hosts but a look at the stats might suggest otherwise.
Notts Line Up (4-4-2)
Sam Slocombe
Richard Brindley
Alex Lacey (Turner 45')
Connell Rawlinson
Dion Kelly-Evans
Jake Reeves
Michael Doyle (C)
Jim O'Brien
Enzio Boldewijn
Elisha Sam (Roberts 66')
Kyle Wootton
Substitutes not used:
Ruben Rodrigues
Jimmy Knowles
Matty Wolfe
Notts made another bright start which is becoming a bit of a theme this season with Elisha Sam latching on to a Jake Reeves through ball for a well taken goal on 6 minutes.
This was a glimpse of what Sam could offer Notts in the future if given the opportunity although having watched the goal back several times I can't help but think Notts were a little lucky as it did appear to be a fraction offside. Thankfully no VAR at this level!
Unfortunately Sam's goal was the only attempt Notts had in the first half, in fact Notts didn't have another goal attempt until the 64th minute so a whopping 58 minutes without having a pop at goal.
Notts spent pretty much all of that time on the back foot with the Shaymen having the best of it until the introduction of Callum Roberts on 66 minutes who replaced goal scorer Sam.
Opportunities for both sides were few and far between in the second half and when they did arise a lack of composure in front of goal ensured the score line remained the same until the 4th minute of added time.
Notts essentially had the game won and a free kick deep in the Halifax half. Unfortunately in an attempt to keep possession and run down the clock possession was given up far too easily from the free kick and a long clearance should have been cleared into row 'z' by substitute centre half Ben Turner. Instead he appeared to lose flight of the ball allowing it to bounce over his head where an alert Jamie Allen was able to capitalise on Turner's lumbering movement, latching on to the loose ball and sliding past the onrushing Notts keeper for the last gasp equaliser.
In truth it was no more than Halifax deserved in a game that neither team warranted a win.
I've left this report a bit late so will be including the Chesterfield preview at the end of the article.
On to the stats . . .
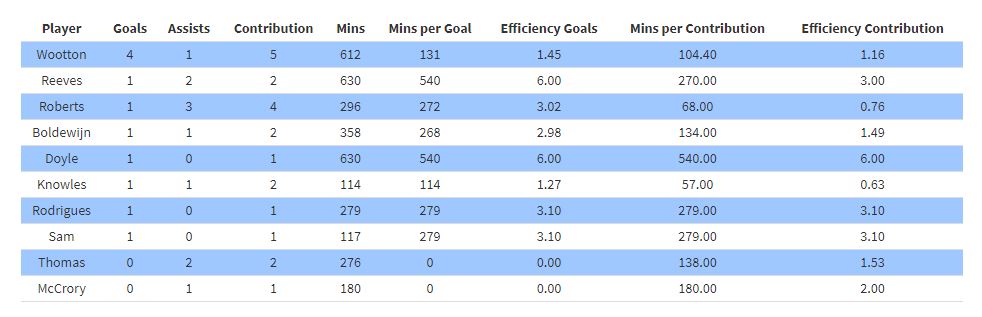
A new table for goal contribution below. An searchable version of this table is on the player stats page of the website.
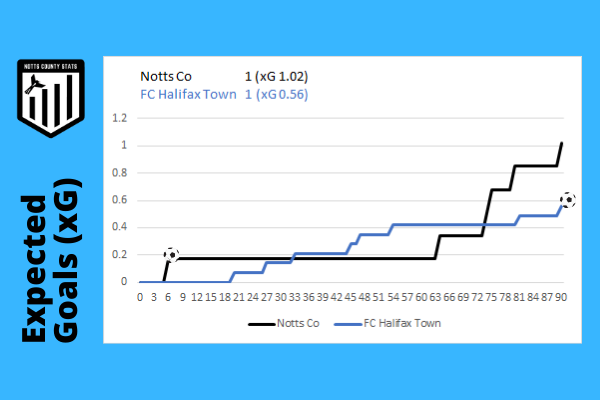
We were expecting a low xG for this game and didn't we get it! You can clearly see from the chart the 58 mins of absolutely no goal attempts by Notts whilst they sat deep and invited halifax on to them who in turn did very little themselves to take advantage of it.
Notts gained some momentum again with the addition of Roberts on 66 mins who really should have scored but as previously mentioned it just wasn't good enough from the Magpies with Halifax capatilising on some shoddy possession at the death.
Points needed and with 7 games played Notts have a PPG of 1.428 which would see a return of just under 63 points over 44 games. Again, I have created an interactive chart where you can filter the chart elements by selecting items in the filter legend at the top of the chart to get a better view of progress versus target(s).
Results tracker updated:
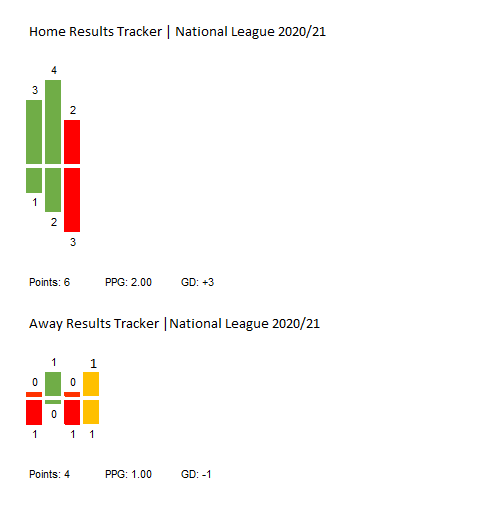
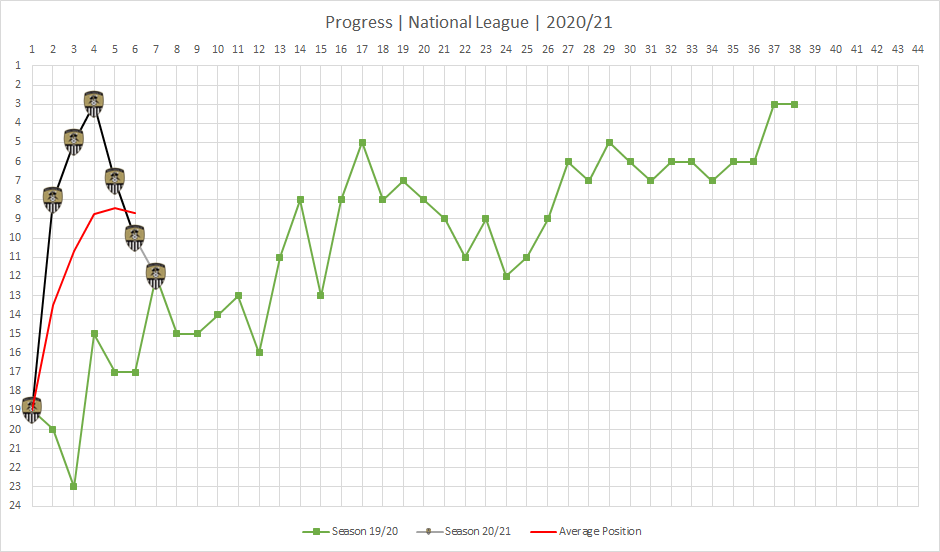
League progress now and the draw leaves Notts in exactly the same position they were in after 7 games last season. The worrying thing is that last season there was clearly an upward trajectory by this point whereas this season it is starting to take a dip. The red line shows average position for the season so far which is currently 9th place.
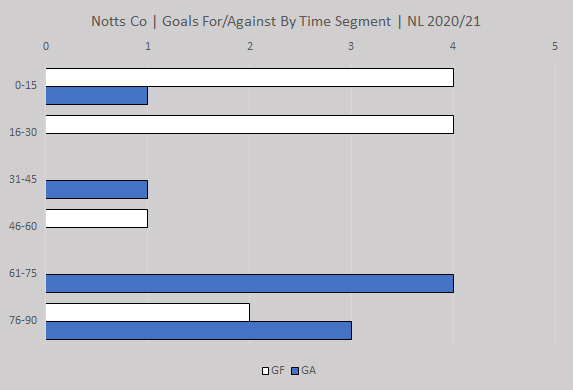
Goal time segments updated and there appears to be a Jekyll and Hyde issue for Notts either side of half time with 8 of Notts goals scored in the first half and just 2 conceded compared to the second half where Notts are struggling to score and prevent goals conceding 7 compared to 3 scored.
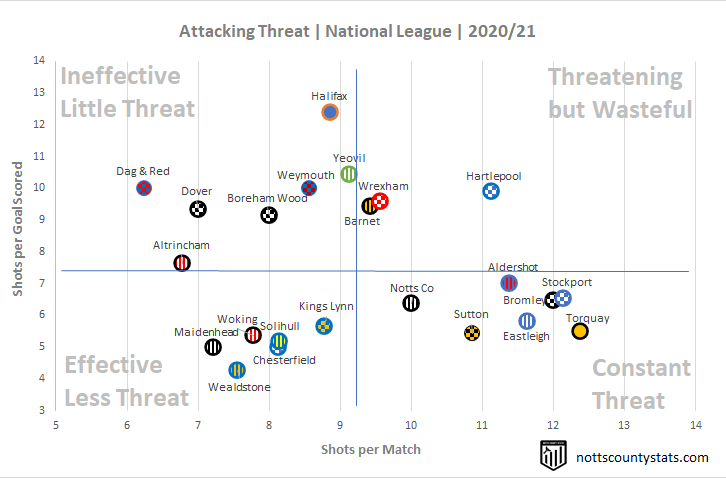
A slight change to attack and defence stats now as I have decided to look at all teams to see how they compare.
Like the old charts this one shows attacking efficiency. The further to the right means you are more threatening, having more goal attempts per game and the futher up you go means less effective because you need more shots to score.
In the table below you can see that at the moment Torquay are the most threatening team in the league but are also quite effective needing just under 6 attempts per game to score.
Halifax on the other hand are only averaging around 9 shots per game and are needing at least 12 shots per goal (unless Notts are in town).
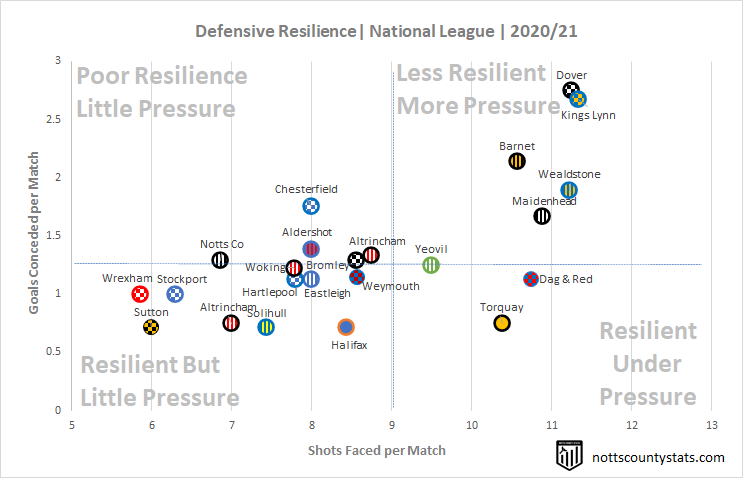
The next chart shows defensive resilience.
The further to the right you go the more pressure you are inviting on yourself. The further up you go the less resilient you are defensively.
In this chart you can see that Dover and Kings Lynn are conceding the most times in a match but are also inviting the most pressure.
Sutton are proving to be the most resilient at the moment inviting very little pressure and conceding just 0.71 goals per game.
Another new one here. I've added an interactive chart that plots goals scored for the season. Each dot represents where a goal has been scored on the pitch. If you hover over or touch a dot it should open up a dialogue box with info about the goal, time scored, any assist, how it was scored etc.
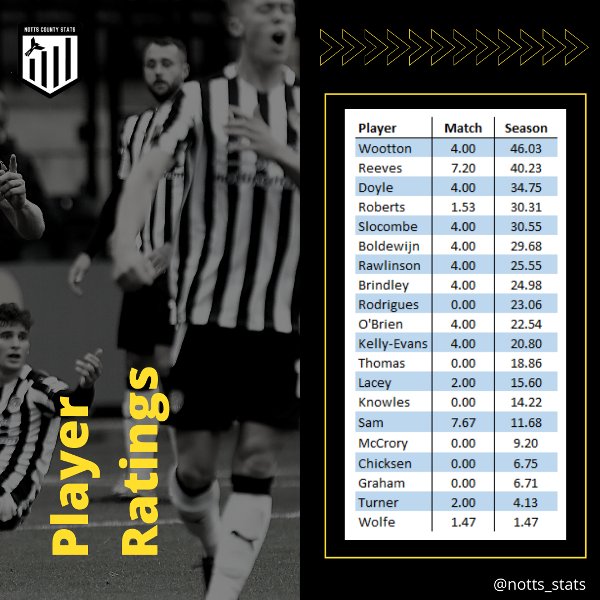
Player ratings updated after match 7.
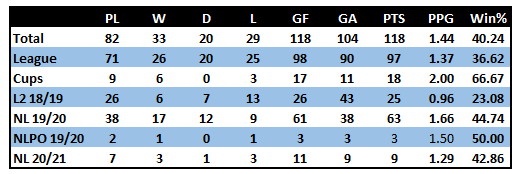
Neal Ardley's record updated:
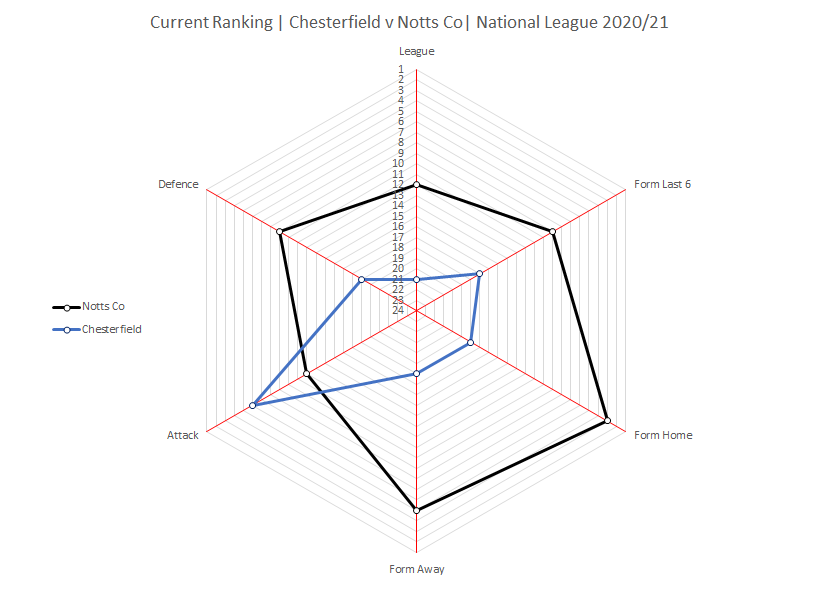
So on to Saturday and Chesterfield away.
The Spireites will be playing under the watchful eye of John Dungworth who steps in as caretaker manager after a string of poor results saw the departure of John Pemberton by mutual consent earlier this week.
A quick look at the radar for the two clubs would suggest that although Chesterfield have been leaking goals they still remain a threat up front and currently sit 6th place in the current attack standings.
Chesterfield last 6:
W 1 | D 0 | L 5 | F 8 | A 12 | GD -4 | PTS 3 | PPG 0.50
Notts Last 6:
W 3 | D 1 | L 2 | F 11 | A 8 | GD +3 | PTS 10 | PPG 1.67
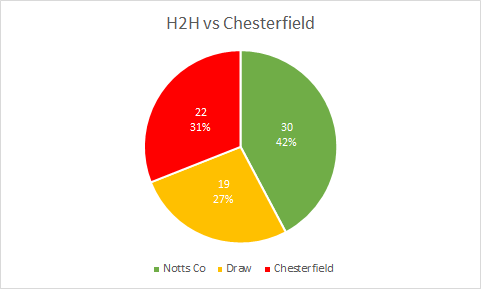
Notts and Chesterfield have faced each other 71 times in all competitions with Notts having the better of it.
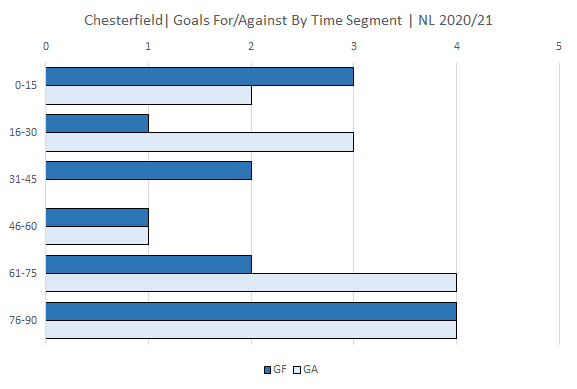
Goial segment for Chesterfield suggests they have goals in them but know how to concede as well with a total of 27 goals being scored in their 8 games so far this season.
Notts have been poor in front of goal second half but that is where Chesterfield have conceded most.
xG and aG for both clubs listed below. Chesterfield have averaged a goal every 5.77 attempts and average just over 9 attempts per game meaning we will be using an xG rating for the game of 0.16.
xG Chesterfield = 0.16
aG Chesterfield = 1.62
Similarly Notts have averaged a goal every 6.36 attempts averaging 10 goal attempts per game which means we will be using an xG rating of 0.157 rounded up to 0.16.
xG Notts Co = 0.16
aG Notts Co = 1.57
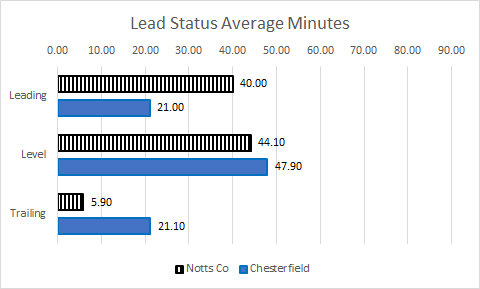
Lead status for the two teams suggests Notts have enjoyed more game time leading and less game time trailing than Chesterfield.
A win for Notts should see a small jump up the table with an outsude chance of getting back into the top 7. A defeat would certainly set the alarm bells ringing a little more than they already are for some fans.
A win for Chesterfield would do much to boost their confidence and should see them back outside of the relegation places.
Again the bookies fancy Notts for the win with 21/20 the best I can find at the moment. You can get 5/2 for the home win or 13/5 for the draw.
Based on current odds Notts have a 45% chance of the win and Chesterfield 27%.
On the face of it this is yet another game that you would really expect Notts to go out and pick up the 3 points but performances of late, albeit staggered have been inconsistent and under par to say the least. That said there is enough attacking threat in the Magpies ranks, especially with the return of Roberts to put this one to bed.
Fingers crossed!
COYP!
Richard
Note:
Betting odds are only used as another means to assess current form and sporting industry expectations of possible result. Notts County Stats do not endorse any form of gambling or betting industry associated businesses.