Notts face last seasons National League South play-off winners at the Bob Lucas Stadium in a game that the hosts manager has already started the mind games declaring Notts to be a massive team with a big budget.
But with two wins in their last two outings against Hartlepool and Aldershot the Terras boss may be overplaying the underdog tag just a little.
Before we get into the Weymouth preview here's a quick look back at the xG stats for the Solihull match as promised.
To say Notts had a slow start is an understatement and looking at the xG data Solihull's early chances should have been enough for them to win the game.
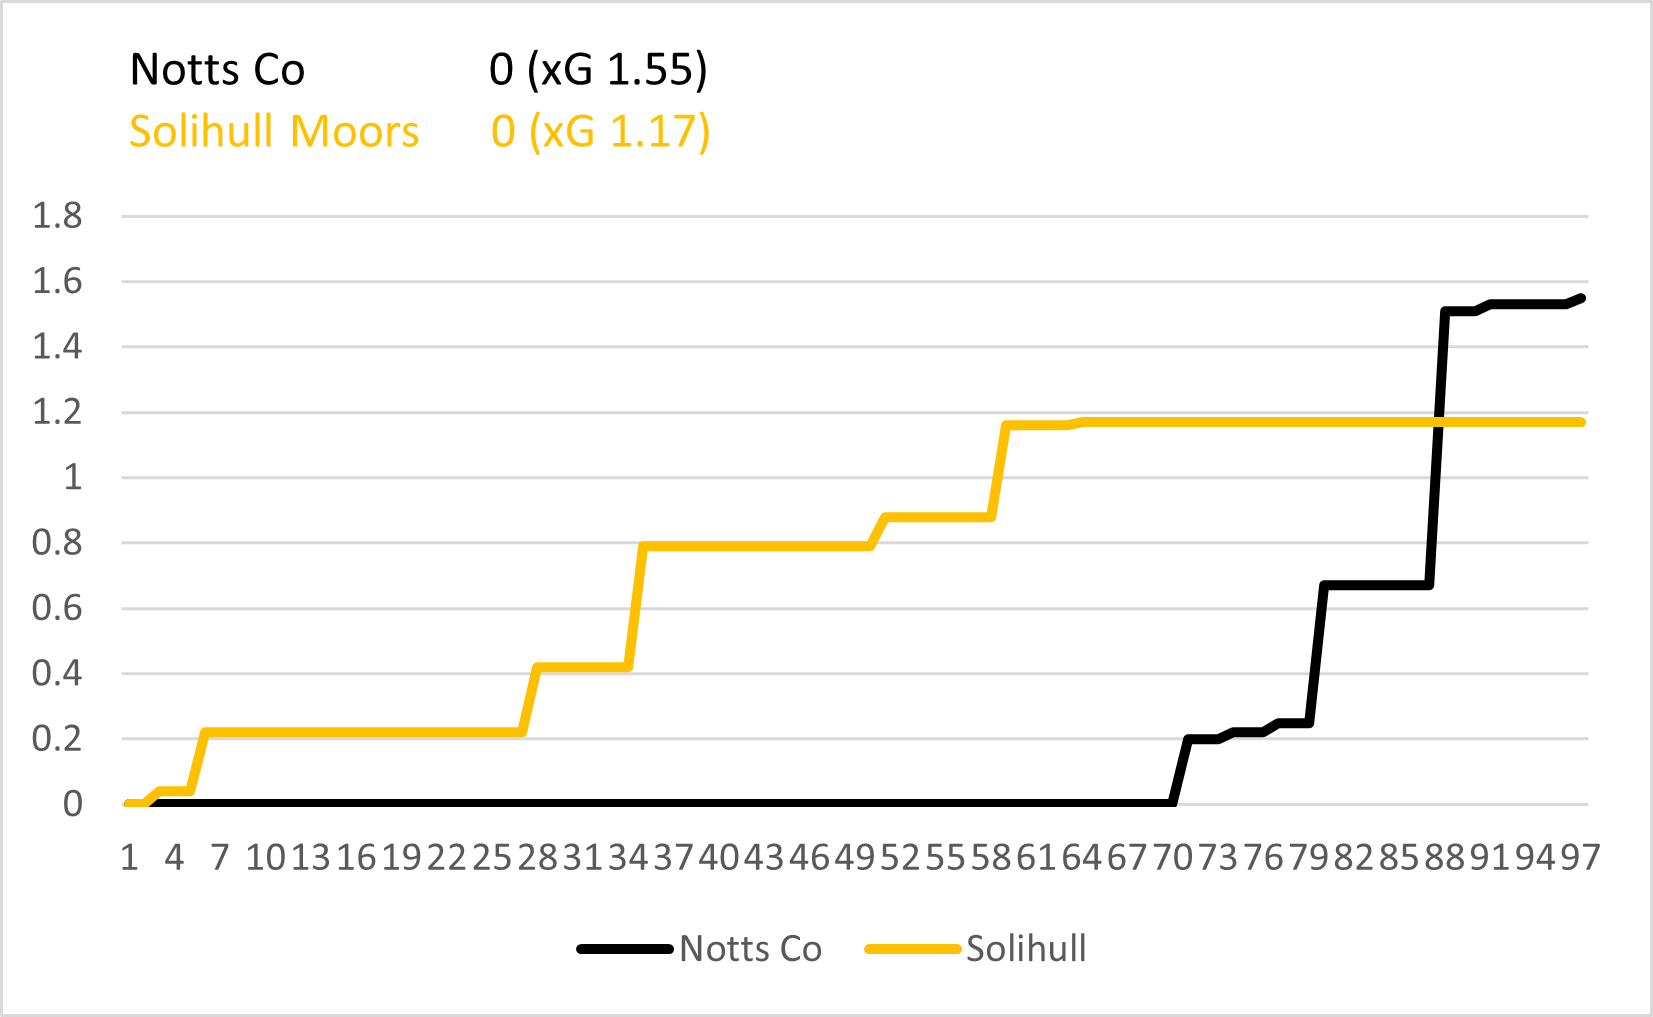
My initial data suggested it was 62 minutes before Notts had sight of goal but the xG data has it at 70 mins, the effort from Kelly-Evans.
Notts' late pressure saw them record a higher xG rating for the game but Solihull still did enough to secure a higher expected win % despite parking the bus for the last 30 minutes.
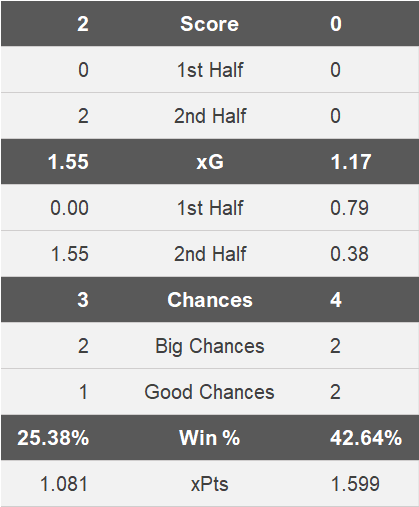
Solihull had the better of the big chances but for a change it was Notts who capitalised on their chances which has been a bit of a stumbling block recently.
Back to Weymouth now and a look at the current form radar.
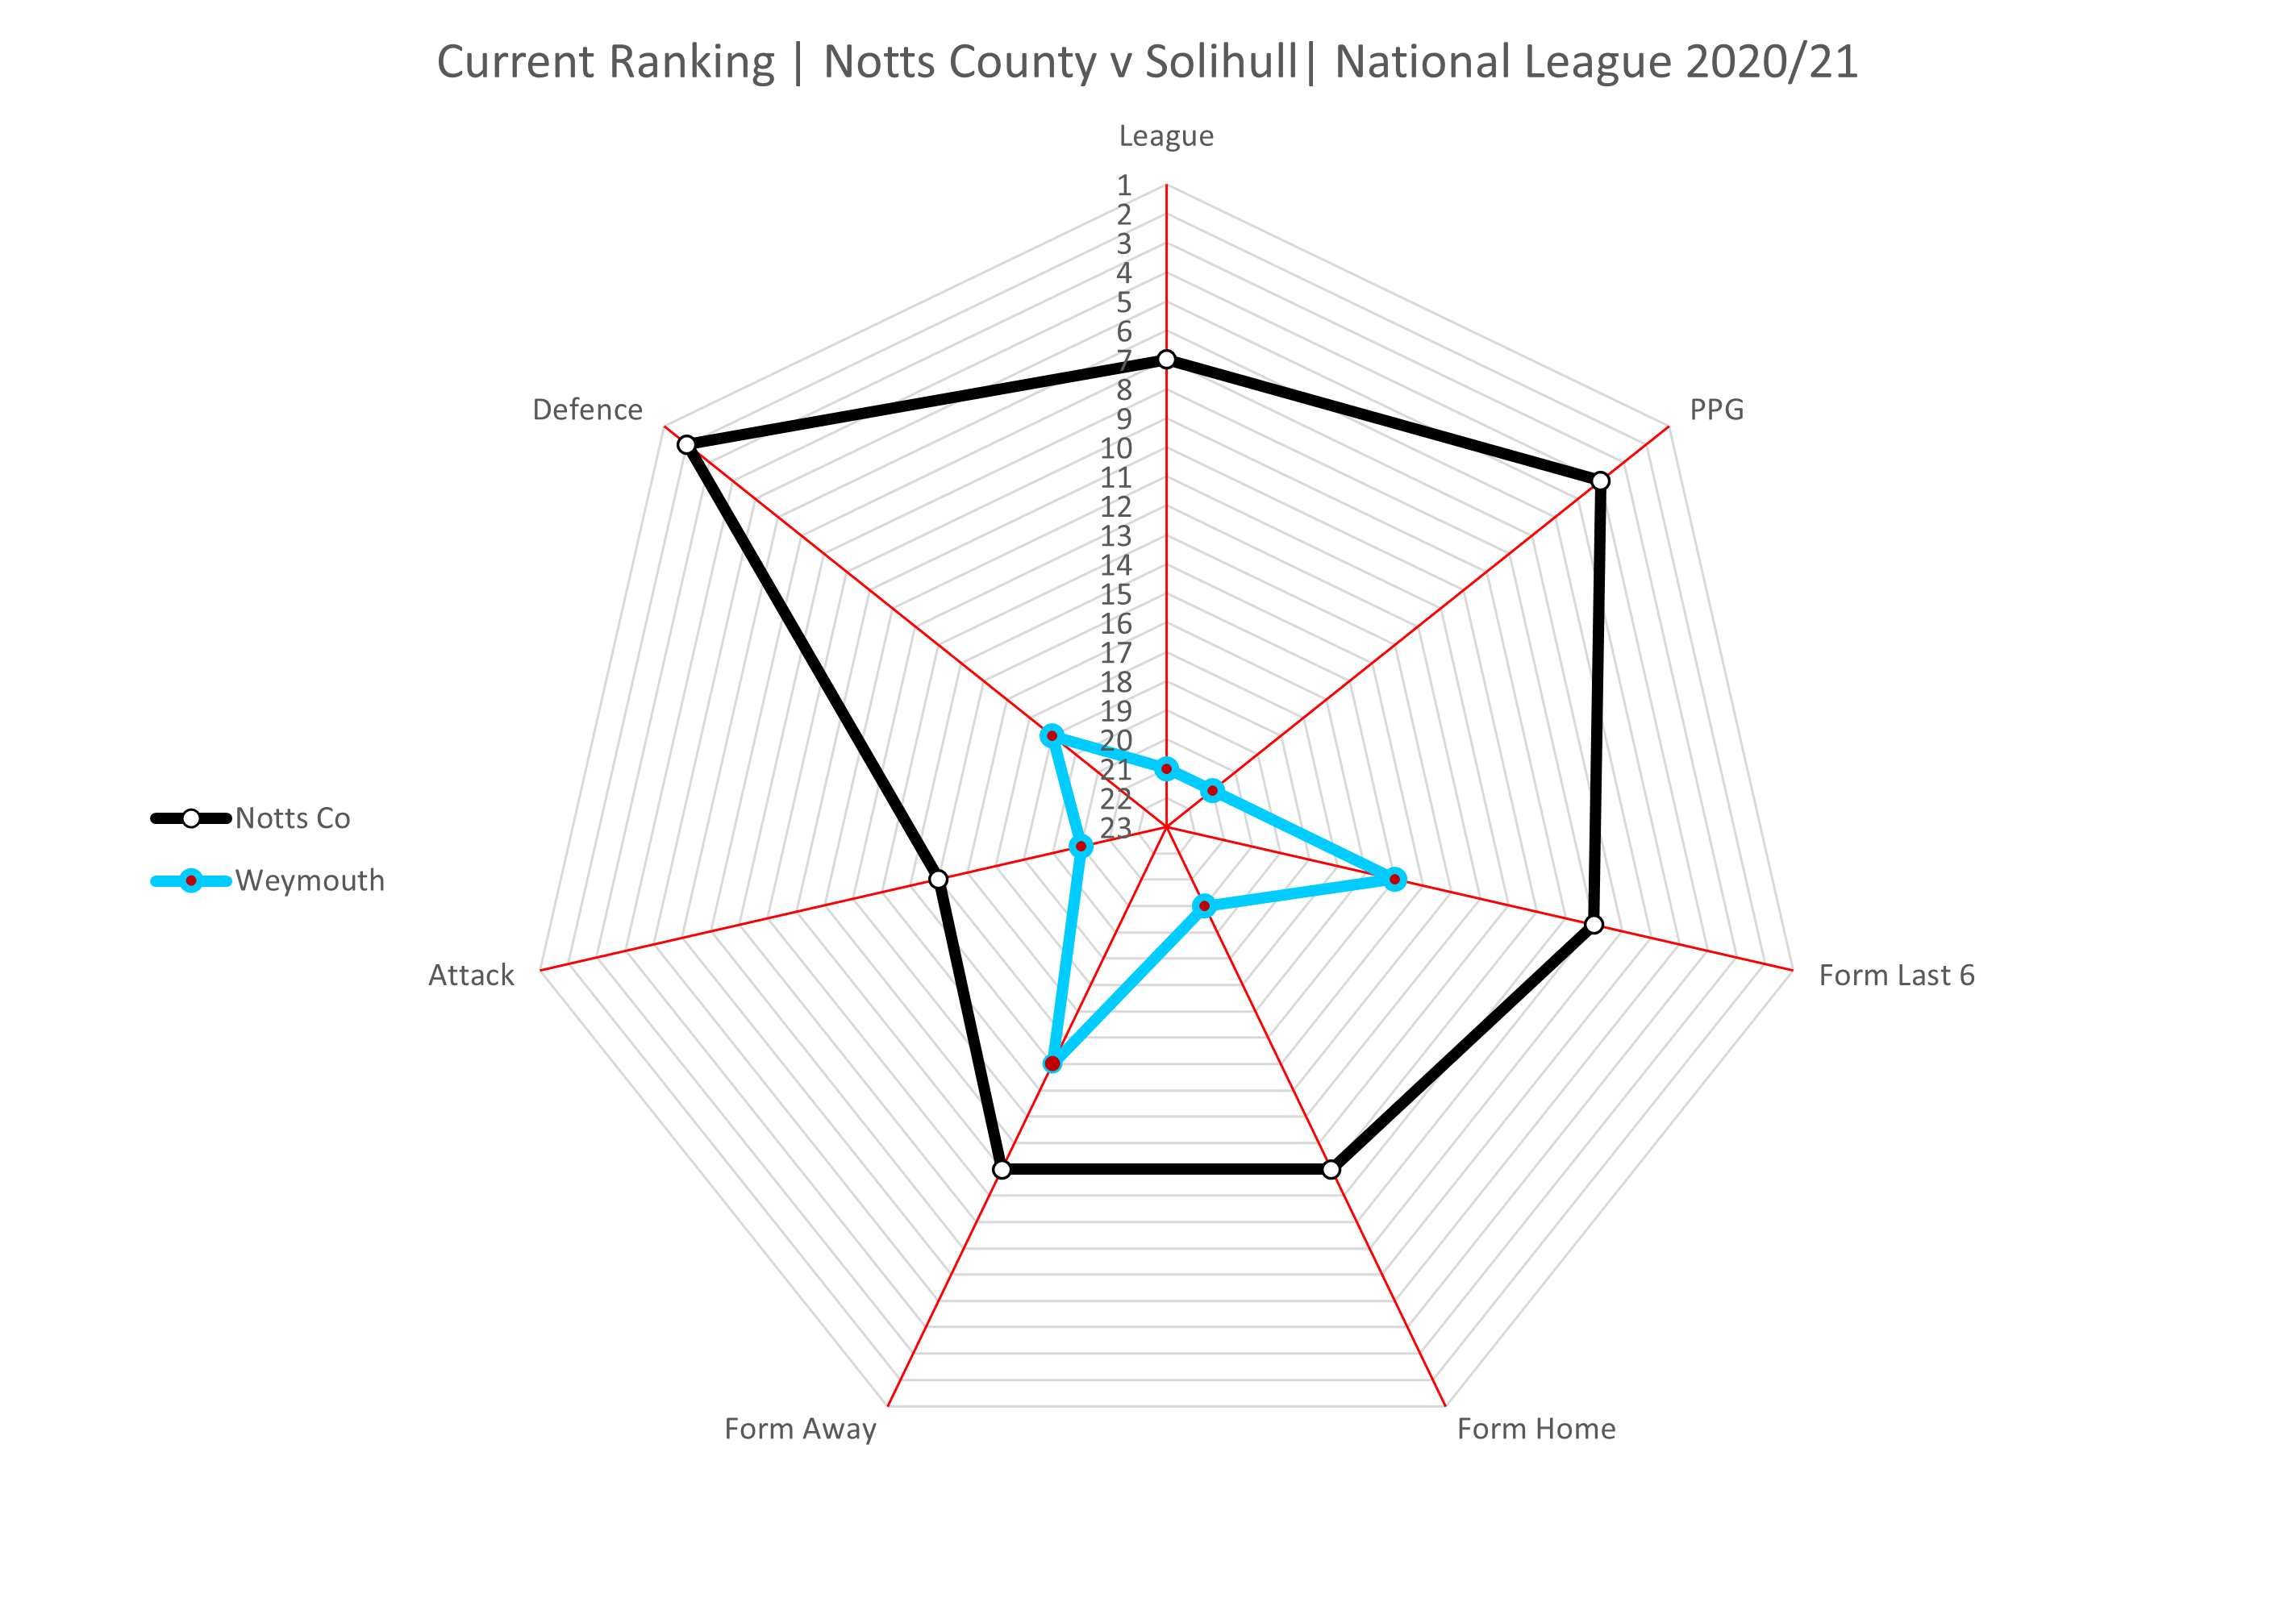
With Notts in the promotion chasing pack and Weymouth in and around the relegation places it's no surprise that Notts look dominant in the form radar and whilst the Magpies away form leaves a bit to be desired the Terras home form is currently amongst the worst in the league.
Goals by time segment for Weymouth and with 20 goals for and 31 goals against it's difficult to see if there is any pattern to their play other than they have conceded an equal amount of goals at every time segment within the 90 minutes.
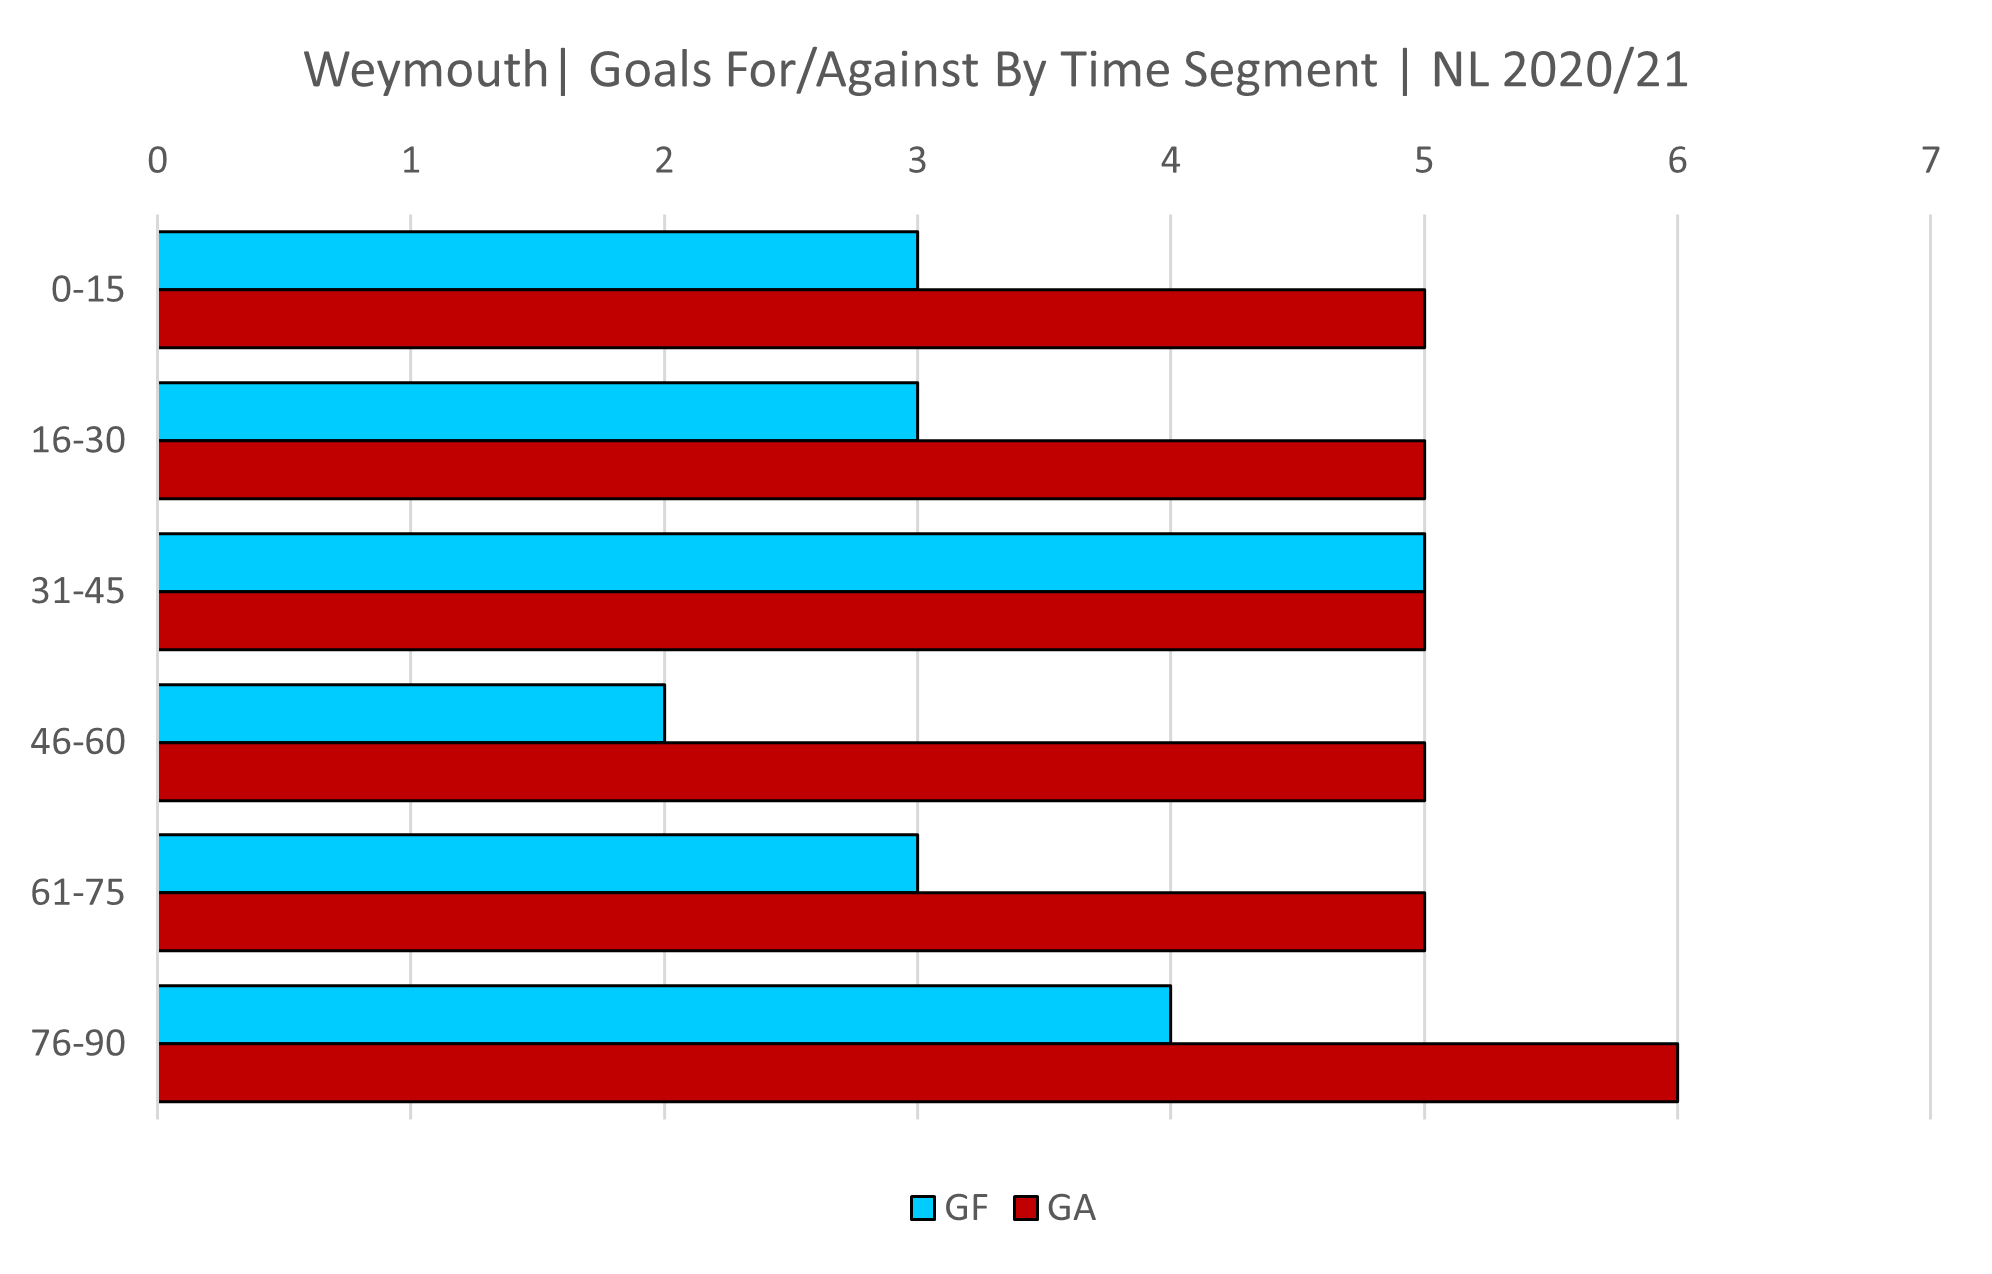
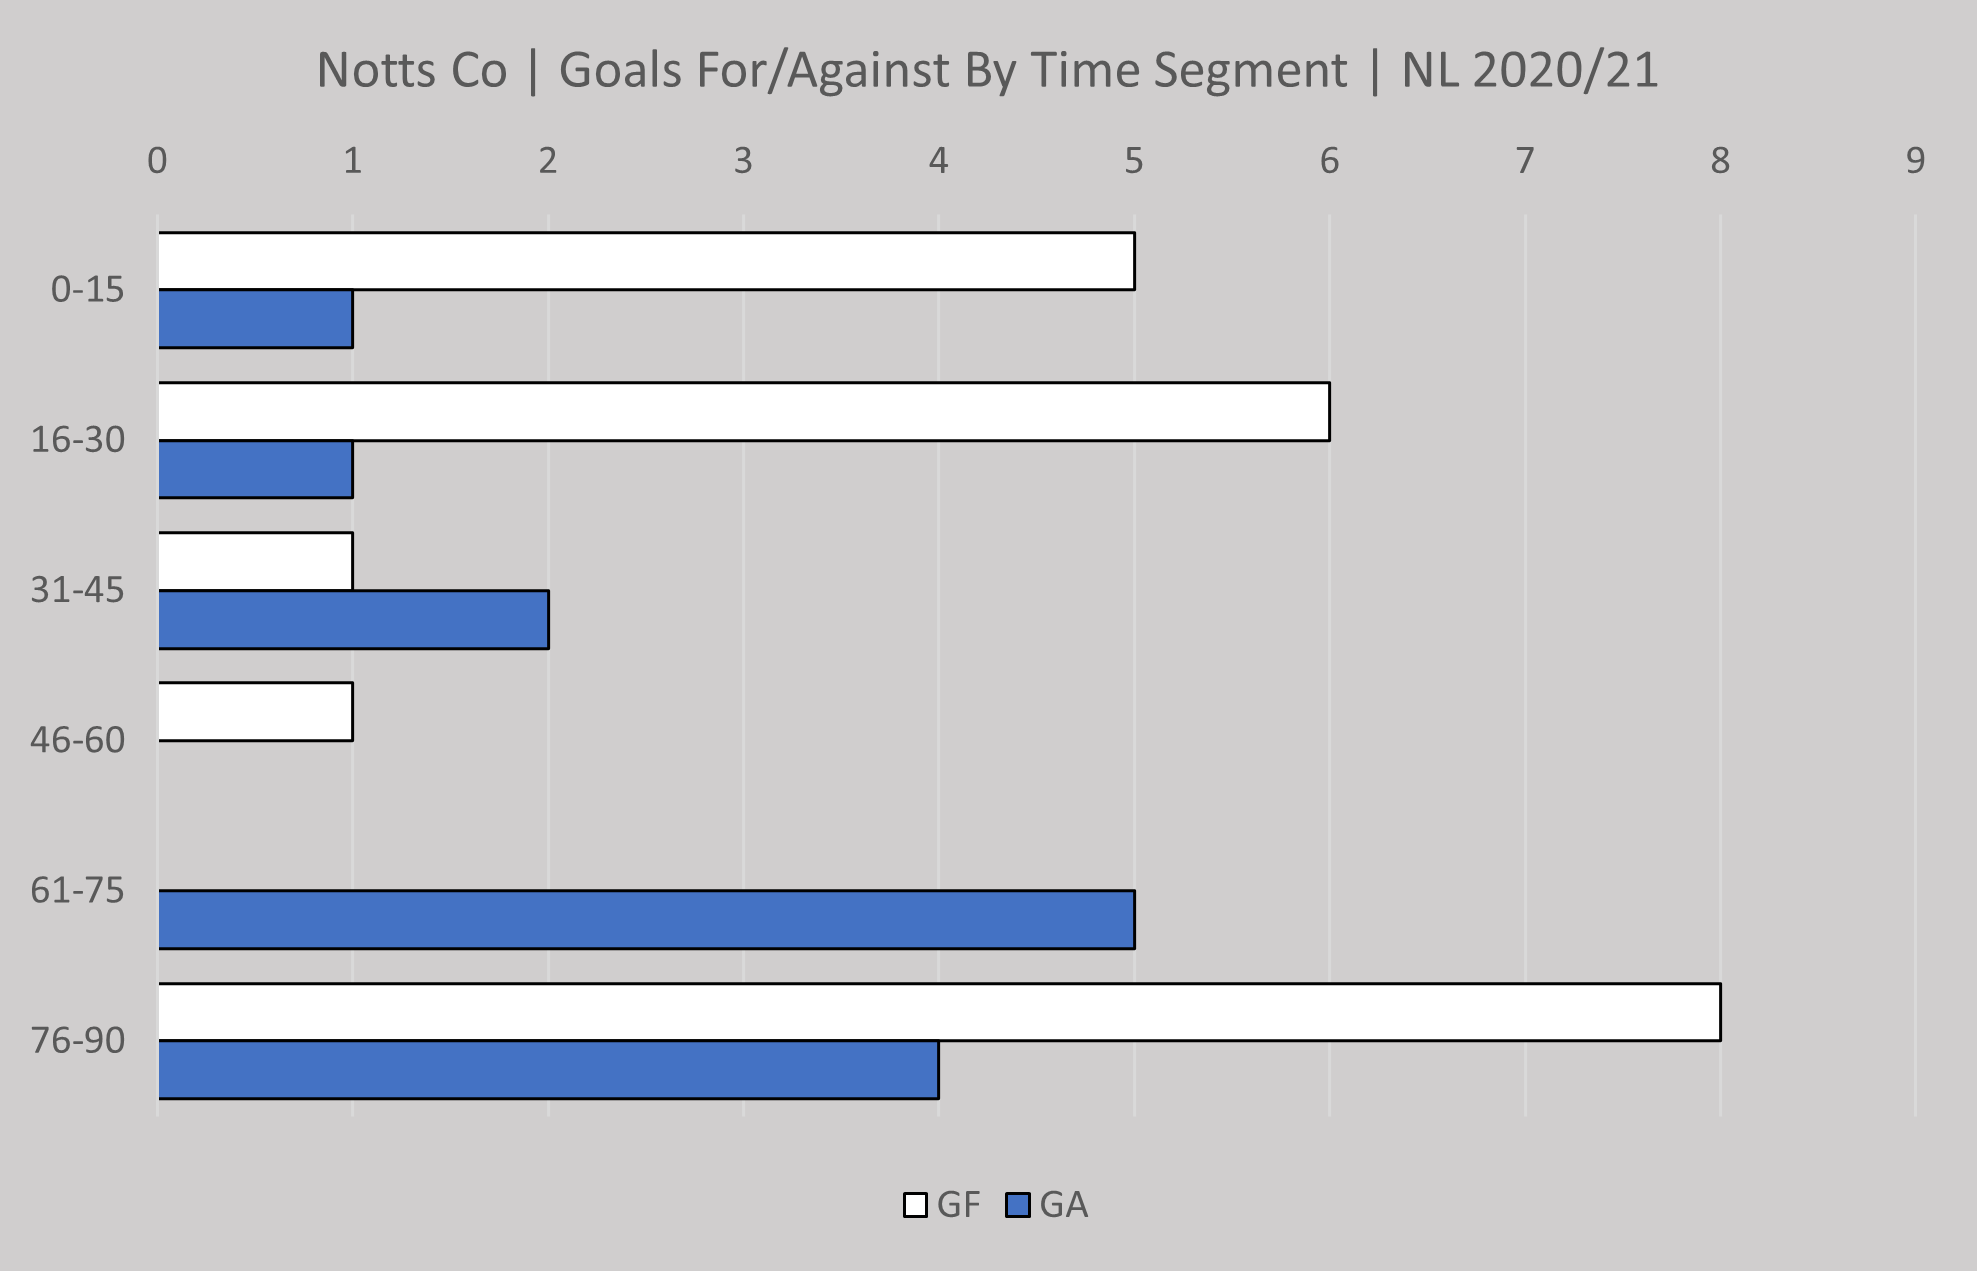
By contrast Notts continue to keep it tight at the back and are still to concede a goal between 46 and 60 mins but equally are yet to score a goal between 61 and 75 minutes which is also the period they look most vulnerable. More late goals gives some comfort that Notts have proved they can finish strongly when it matters.
Weymouth are averaging just 1.11 goals per game and only average 6.65 goal attempts per game meaning they score on average every 5.99 attempts per goal which on the face of it suggest they create very few chances but then are quite efficient with the chances they get.
Notts are averaging 1.31 goals per game and average 11.75 goal attempts per game meaning they average a goal every 9.97 attempts which is indicative of a team creating plenty of chances but not particularly effective in front of goal . . . although that was turned on it's head in the Solihull game.
Weymouth are shipping 1.72 goals per game on average from compared to 0.81 goals per game for Notts. Additionally Notts patient pasing game means they have average 56% possession for the season so far compared to 43% for Weymouth so everything is pointing towards a game that Notts really should be looking to control.
Weymouth have an average xG of 0.73 goals scored per game. Their actual goals scored is higher at 1.11 which again confirms that although they don't create many chances they make the most of what they do.
Notts xG average is 1.27 which is almost the same as their actual goals scored of 1.31 per game.
Weymouth's xPTS for their 18 games so far is 15.20 which suggests their performances and actual position are pretty much aligned and where you would expect them to be.
Notts xPTS for their 16 games played is 25.60 which is 1.40 points less than their actual points tally so far. This might indicate they are over achieving but the margins are small enough to say compared to performances the Magpies are essentially where you would expect them to be.
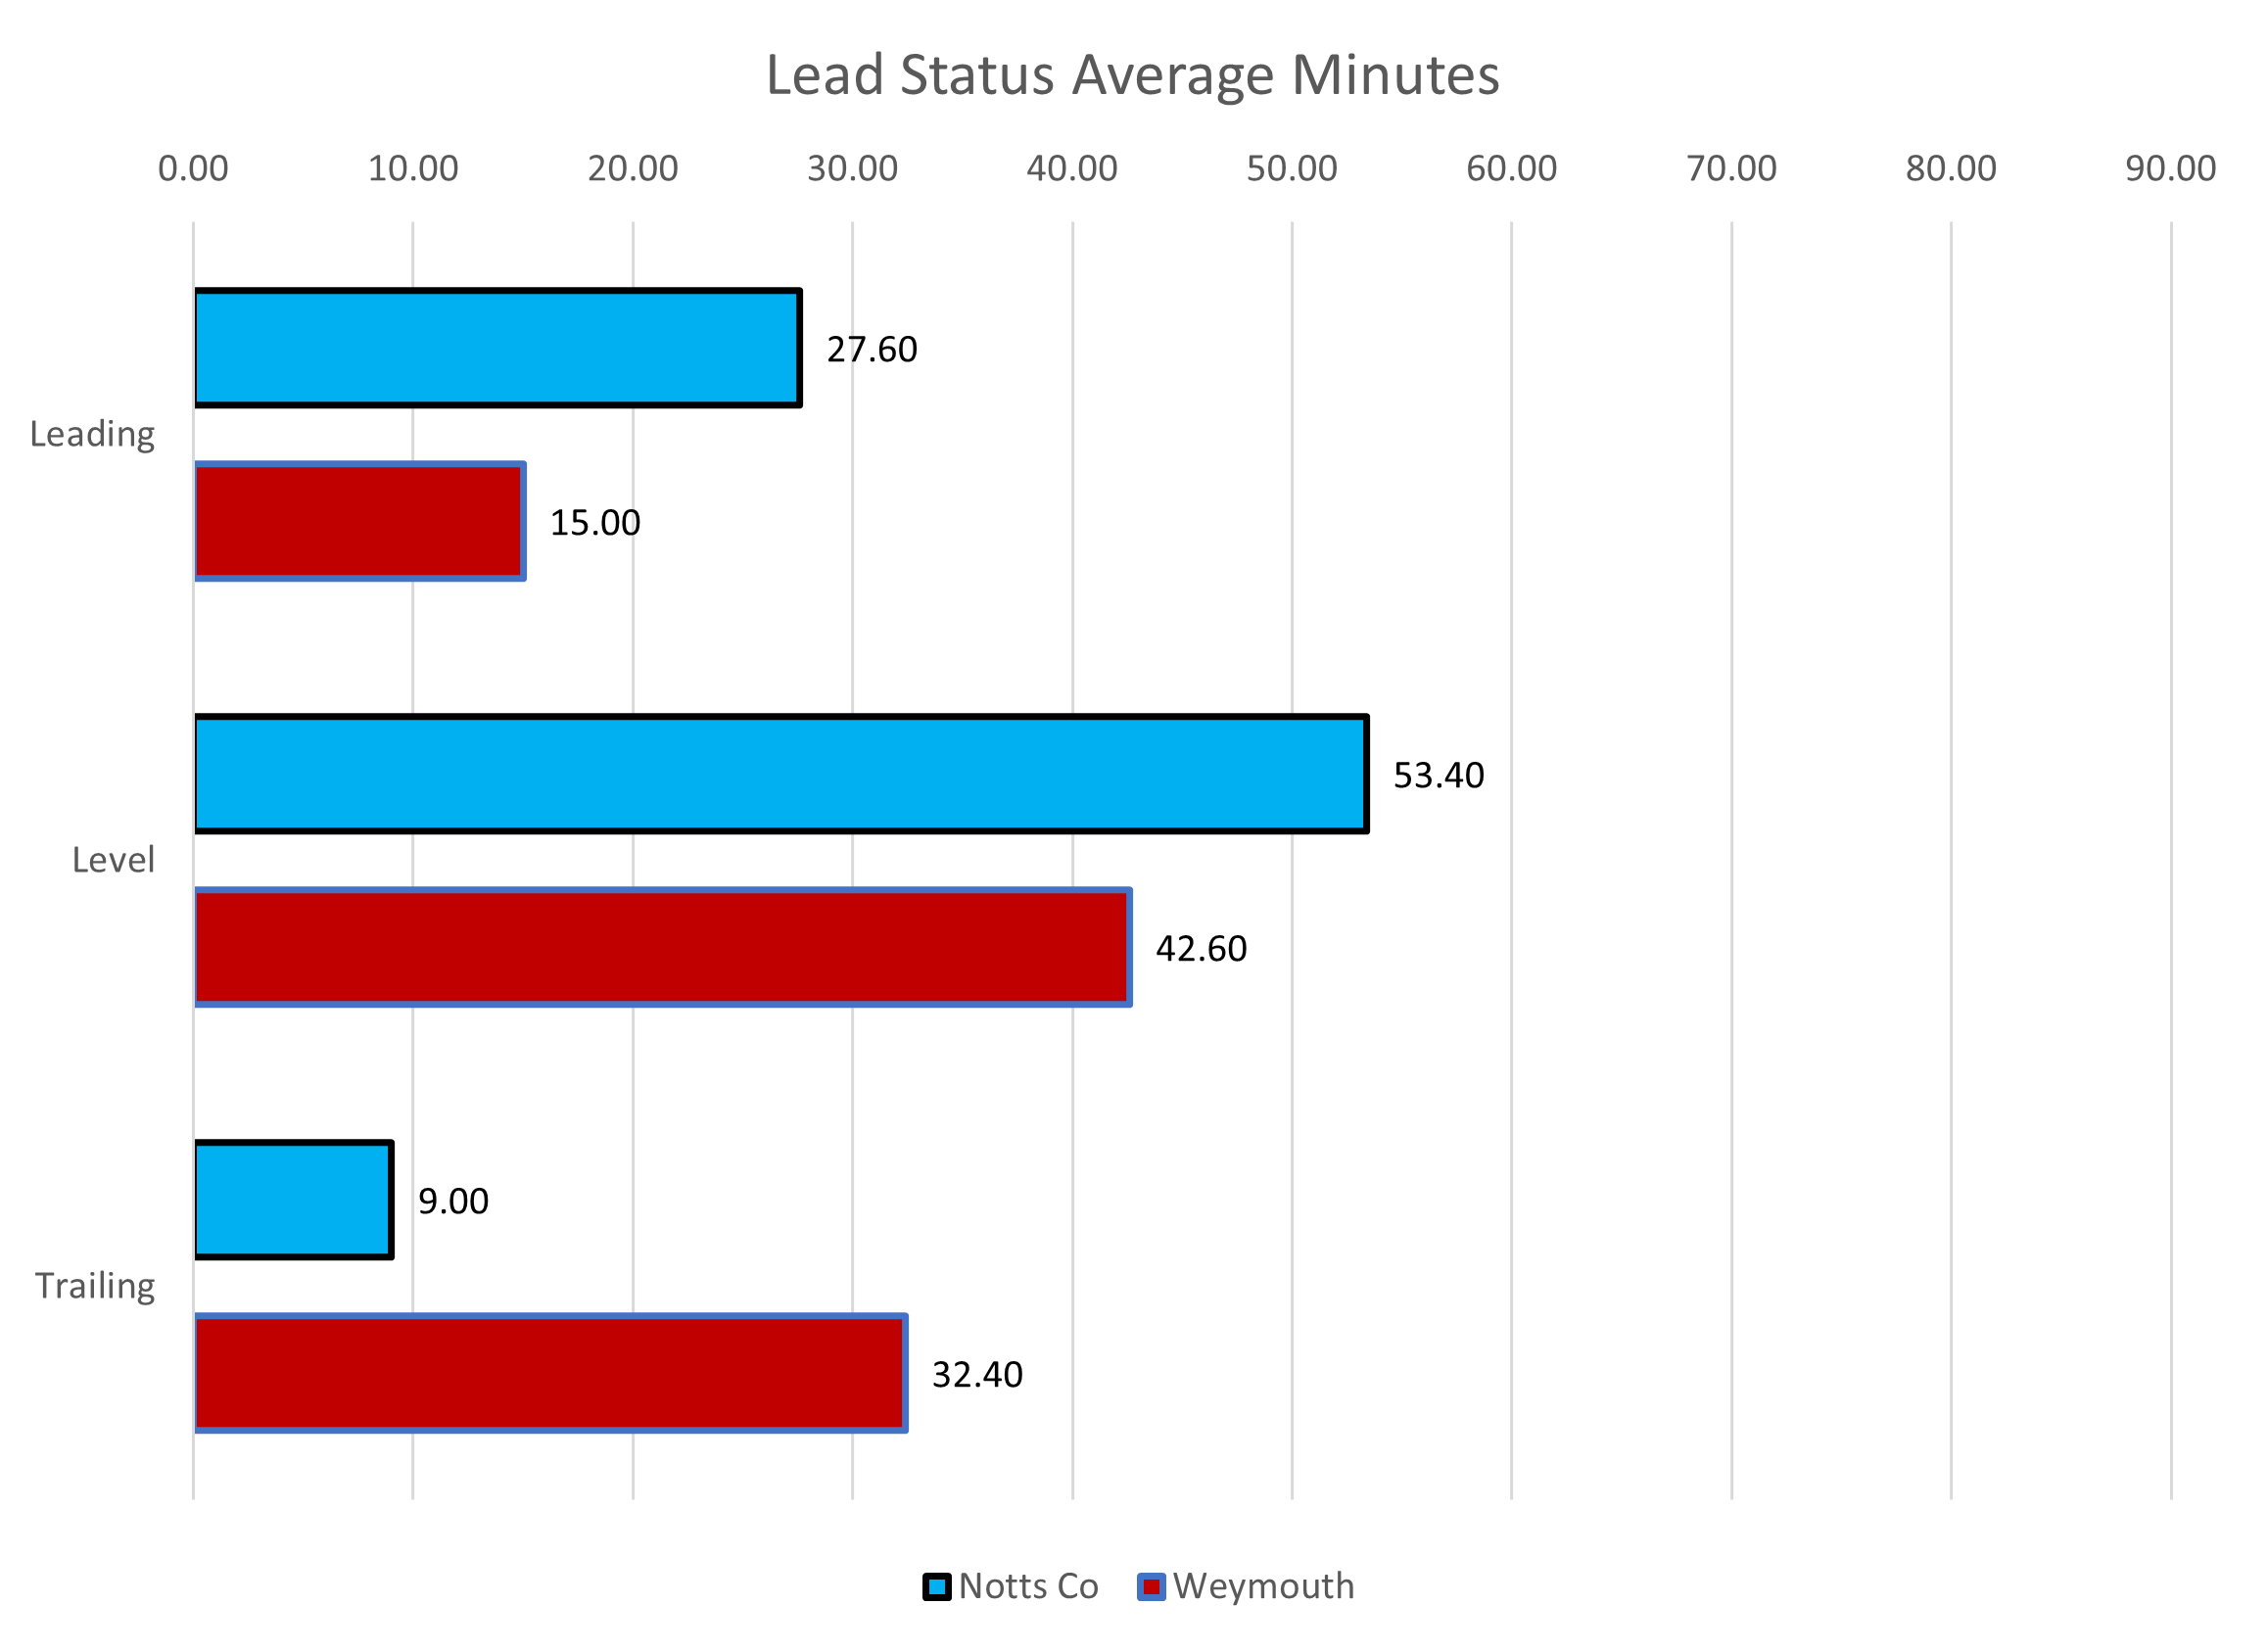
Lead status tells us again that Notts are behind in games considerably less than Weymouth.
Depending on results elsewhere a win for Notts could potentially see them go 3rd on goal difference.
A defeat could see a drop down to 10th on goal difference depending on how things pan out for Solihull, Maidenhead and Boreham Wood.
Notts are ridiculous favourites with the bookies at circa 9/25 but 8/1 for the home win might offer some conolation if Notts lose. The draw is coming in at 4/1. (Odds Bet365).
Based on these odds Notts have a 74% chance of winning but historically win about 70% of their games with similar odds.
In conclusion Notts should be looking to come away from Dorset with the 3 points firmly in the bag, however Weymouth have found a bit a form winning their last two games.
It's worth noting that in both those games Weymouth ended up playing against 10 men, Hartlepool by all accounts should still have come away with something from their game even though a player light for 70 minutes and Aldershot were 1-0 down when their keeper got sent off for handling outside the box.
Just goes to show you results don't always tell the full story . . . that's why we analyse the stats!
COYP!
Richard
Note:
Betting odds are only used as another means to assess current form and sporting industry expectations of possible result. Notts County Stats do not endorse any form of gambling or betting industry associated businesses.