It's been an interesting season and despite the disappointing finish we do leave ourselves wondering what could have been had the season not been curtailed by the coronavirus outbreak.
That said there is much to look forward to and there was plenty to look back on in the clubs first ever season of competition outside of the football league.
Notts officially finished the season in 3rd place on 63 points from 38 games meaning an unweighted PPG average of 1.658. Full interactive league table can be viewed here
Points gained by season segment is detailed in the chart below.
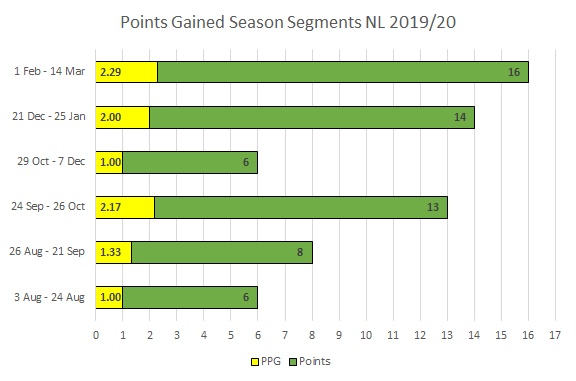
What this clearly shows is that after a slow start there was continuous improvement but then we hit a very poor patch in November similar to the form we saw at the beginning of the season with just 6 points from 6 games. A very good December got us back on track and by March results and performances were amongst the best in the league.
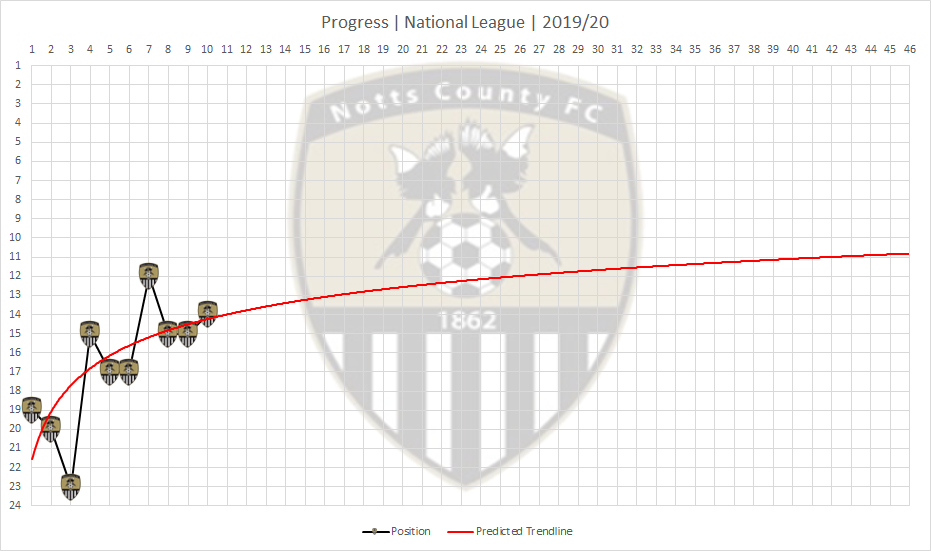
We tracked the league progress throughout the season and added a trend line to determine what the possible outcome for the season might be.
After 10 games progress was slow and despite a bad start things were looking to improve. However at that point in the season had the same trend in results continued an 11th place finish was likely.
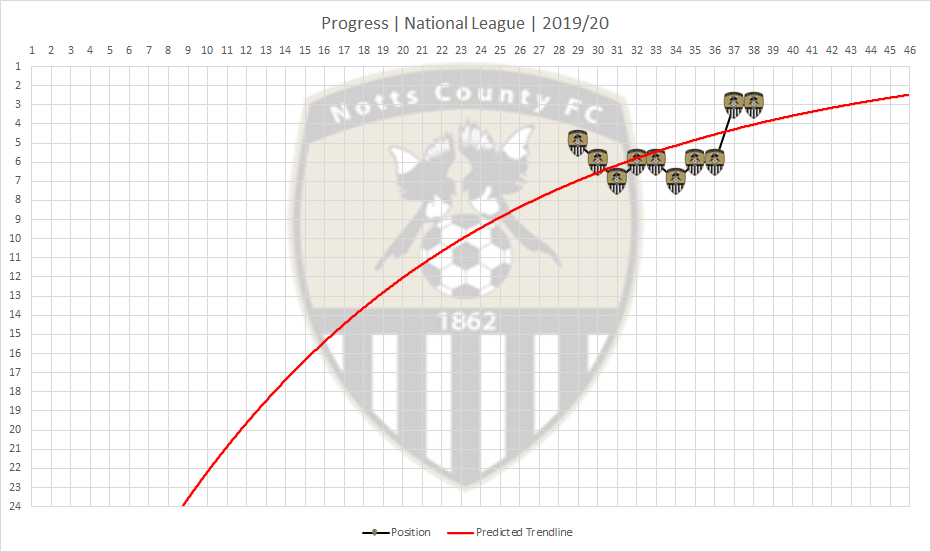
If you compare this then to the last 10 games the trend line confirms that a second place finish was not out of the question and provides another clear indicator of the improved form witnessed over the final stages of the season.
The biggest league win of the season came in the form of a 5-1 victory over National League part-timers Chorley Town which also represents the most goals in a league game for the season (6) alongside the 4-2 win at Halifax in December.
The biggest win on the road was the 4-0 victory over Woking Town in October.
The biggest defeat was also at home, losing 0-3 to Barrow. The biggest defeat on the road in the league was in the game at Yeovil where the 3-1 scoreline really didn't do Notts justice and flattered the hosts.
Notts managed 15 clean sheets in 38 league games with 9 of those played out at Meadow Lane.
In all competitions Notts played a total of 47 games with the 5-0 win over Aveley in the FA Trophy being the biggest win of the season.
The season's best unbeaten run in the league was 8 games starting with the 2-2 draw at home with Boreham Wood on 26th November and finishing with the goalless draw at home against Dover on 18th January.
The longest spell without a win in the league was 4 games, starting with the 3-0 defeat at home to Barrow in November and if you add the FA Cup defeat away to Northampton that period represents the most games (5) without a win in all competitions.
A full interactive list of all last seasons matches can be viewed here
There was a total of 128 goals scored across all 47 of the Magpies games during the season with Notts scoring 80 meaning a goals scored percentage in all games of 62.50%
This means that Notts' "goals for" per game average equates to 1.70 with a goals conceded average per game of 1.02.
In all competitions Notts have managed an average of just under 11 shots at goal per game scoring a goal on average in every 6.49 attempts.
Notts' highest number of attempts on goal was 20 in the away win at Harrogate Town.
The average number of shots faced per game is just over 10 and as Notts concede an average of 1 goal per game then it means the opposition usually need at least 10 attempts to score a goal.
The following charts show attacking efficiency for all home and away matches in the National League during this past season.
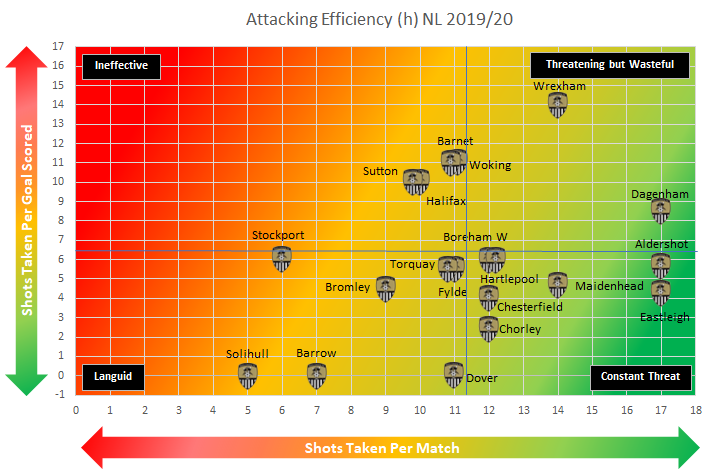
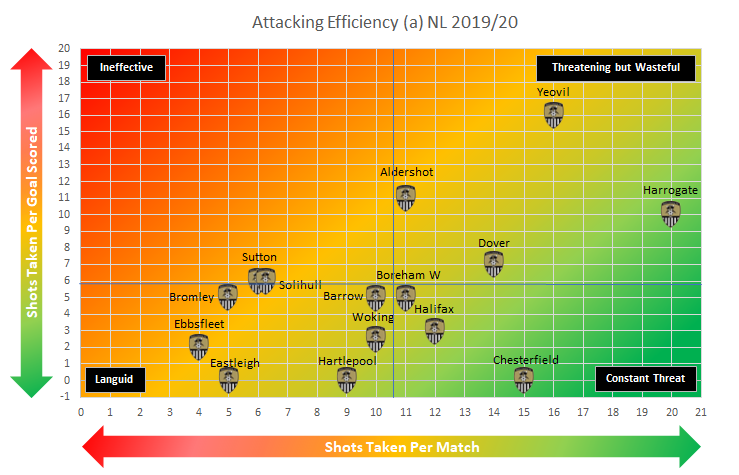
Comparing the two charts it is easy to determine that Notts were much more attack minded at Meadow Lane than on the road, with the exception of the games at Harrogate and Yeovil. Additionally the league game at Chesterfield is a great example of constantly knocking on the door but to no avail and represents the most number of attempts in a game without a goal (15).
The next charts display how resilient Notts were in each game home and away.
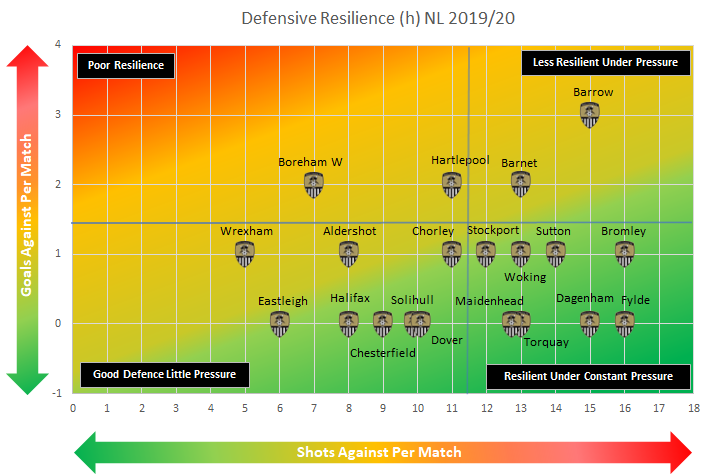
Again it seems clear that on the whole Notts were more resilient at home than on their travels. There are some notable performances though that buck the trend.
You can see from the home chart that Barrow had an absolute field day when they visited and Barnet, Hartlepool and Boreham Wood all made the Notts defence work for their money.
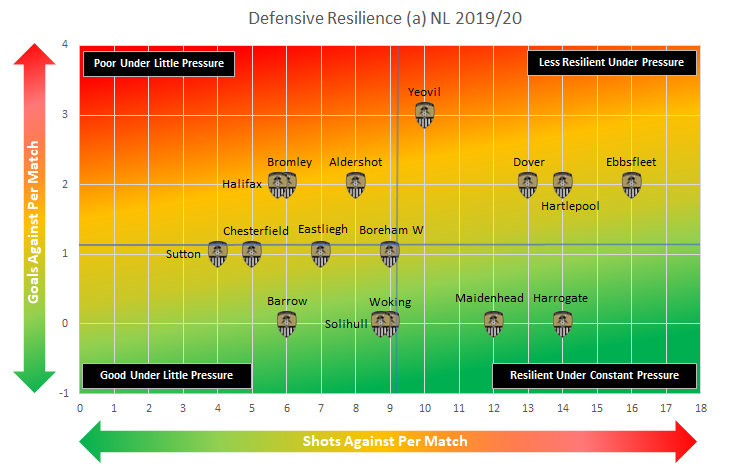
On the road it's more of a mixed bag with good defensive performances at Harrogate, Maidenhead, Woking, Solihull and Barrow. The Magpies were at their least resilient in the away defeat at Yeovil conceding a goal every 3.33 attempts.
Sticking with goals and Kyle Wootton finished the season as the clubs leading scorer with 18 goals in all competitions, 13 of those in the league, 3 in the FA Cup and 2 in the FA Trophy.
Leading scorers for the season are listed in the table below. I have decided somewhat begrudgingly to remove the goal I had afforded to Enzio at Boreham Wood as it appears most official channels had given that as an OG to the Wood keeper, sorry Enzio!
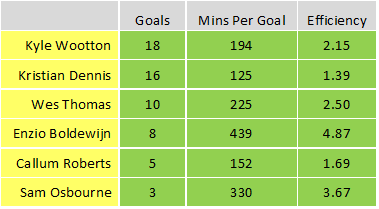
Whilst Wootton looked like finishing leading scorer for most of the season it was clear that Kristian Dennis had become the clubs most efficient goal scorer managing to bag himself a goal every 1.39 games. It would have been interesting to see how many Dennis could have got if given more playing time.
Callum Roberts also deserves a mention. His free kick in the National League final against Harrogate was the only highlight in a depressing game for us Notts fans but it represented his 5th goal in 10 appearances meaning he was averaging a goal every 1.69 matches.
When it comes to goal participation Kristian Dennis with 6 assists to add to his 16 goals tops the chart, level with Kyle Wootton on 22.
Enzio comes in third and there has to be a mention for Regan Booty who considering he spent a large part of the season out with a back injury still managed two goals and seven assists in just 1,462 minutes of game time. It would have been nice to see just what he could have achieved if he had remained fit.
Interactive goal participation chart below.
Goal participation efficiency top spot belongs to Kristian Dennis who was involved in a goal every 91 minutes. Callum Roberts again proving his attacking threat with 5 goals and 3 assists meaning he was involved in a goal every 95 minutes played.
Interactive goal participation efficiency chart below.
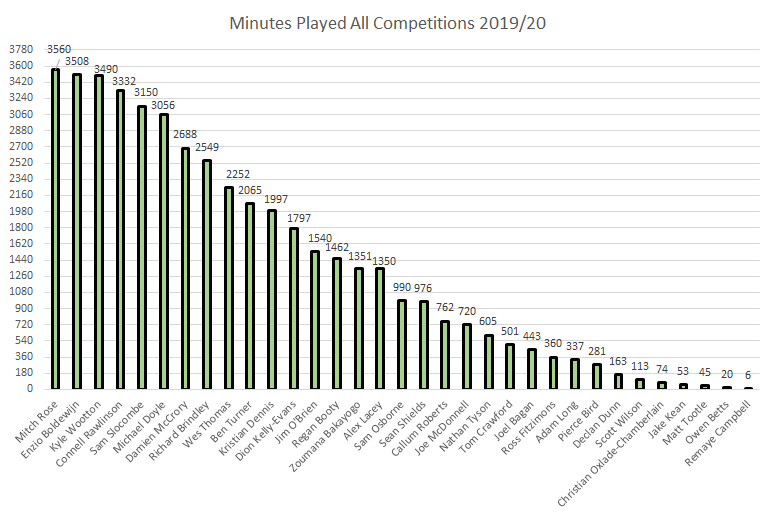
Enzio Boldewijn made the most appearances in all competitions with 41 in total, Connell Rawlinson managed to clock up 40 appearances and Mitch Rose 39.
When it comes to minutes on the pitch Mitch Rose tops the charts with 3,560 minutes closely followed by Enzio and Kyle Wootton.
I decided to take a look at individuals and partnerships to see if there were any obvious trends which contribute to changes in form during the season.
Concentrating on league games only and players with 5 or more league appearances Tom Crawford has the best PPG ratio of 2.63, Alex Lacey is second best with a ratio of 2.36 and Joe McDonnell 3rd with 2.17.
Of those that didn't make 5 or more appearances it's interesting to see that Scott Wilson and Joel Bagan were never on the losing side during the normal season and Adam Long also scored highly with a ratio of 2.25 for the 4 games he played in. This again is an indicator of the form the club was in prior to the season curtailment with all of these players heavily involved with the squad at that time.
This won't be popular but amongst those in the squad whose PPG was lower than the clubs season average of 1.66 were Ben Turner with 1.29 and Jim O'Brien with 1.35 . . . sorry.
The most effective defensive partnership was that of Rawlinson and Lacey who managed a PPG ratio of 2.12 in the league, losing just one game and conceding just 0.5 goals per game.
By contrast Rawlinson and Turner managed 1.60 PPG and conceded on average 1.1 goals per game.
In midfield the most played partnership was that of Rose and Doyle who started a total of 25 league games together and achieving a PPG of 1.56.
There was a small spell of games where Rose was partnered by Regan Booty during which saw an impressive 2.60 PPG. Again, was a real shame Booty had his season cut short by the back injury.
Up front it was clear Wootton would be a regular starter, but the question continuously debated was who should be his strike partner, Thomas or Dennis?
The following stats relate to games where the players started the game together.
Wes Thomas partnered Wootton in 18 league games with the partnership providing a total of 16 goals or 0.89 goals per game.
Kristian Dennis partnered Wootton in 11 league games with this partnership delivering a total of 11 goals so 1 goal per game.
It should be noted that in two of the Thomas/Wootton games Dennis came on to replace Thomas and scored. If we factor this into the equation then goals per game decreases slightly for the Wootton/Thomas partnership to 0.78 and increases for the Dennis partnership to 1.18 goals per game making this partnership slightly more effective.
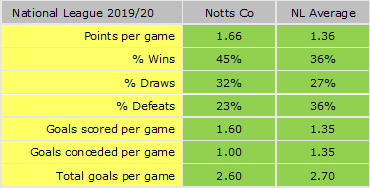
Notts season is compared to the league average in the table below.
Although the season was cut short it still represented Neal Ardley's first full season in charge of team affairs. A full breakdown of his time at Notts since joining the club in September 2018 is detailed below.
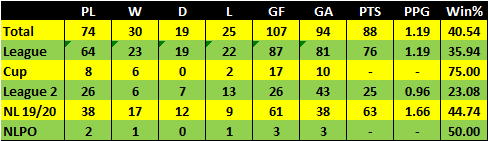
Ardleys win percentage in all competitions for the season is a credible 51%. If you add draws to that figure then his unbeaten percentage for the season is 76.59%.
So that closes off my first season running Notts County Stats. It's been a bit of a bumpy ride and I've not always got it right first time but it's a learning curve and the most frustrating thing about being in the National League for another season will again be the lack of readily available data so I will have to continue to try and come up with informative and engaging stats manually.
One thing I will try and do is create workable xG and xA formula's so we can really drill down on expected goals and assists, not quite sure how but I will try my best . . . Alex and Chris, if you're reading this a little help with data would be greatly appreciated!
Finally just want to say a big thank you to everyone that has subscribed and followed across the social media platforms, your interaction and feedback is very much appreciated and I will also look to see how some of what we do in the future can be more interactive.
As always, thanks for reading . . . COYP!
Richard