So it's been a couple of weeks now since I launched Notts County Stats so maybe now is a good time to have an in depth look at the season so far, results trends, attacking and defending performance and season end predictions.
Of course many will say the only stat that really matters is that final league position on the last day of the season and you can't really argue with that. However it can be interesting to plot progress, analyse trends and put players under the microscope while the season is playing out. Metrics like points per game (PPG) and expected goals (xG) can often provide an insight into how a clubs season might pan out.
Before I dive into the numbers I just want to add a note regarding the stats I provide. The data available to hobbyist analyst for the National League is pretty sparce. Even looking at purchasing data streams from sites like Opta can be very expensive and the data nothing like that which is available for EFL and PL teams.
I have been asked on twitter about xG data and to be honest I just can't find any for the level Notts are currently plying their trade. With this in mind I have ended up spending hours watching highlights and full match replays online to try and gather as much data as I can myself but gathering xG data is still a complicated affair.
To this end I have created some statistical visualisations that I hope will not only provide a snapshot of the clubs progress throughout the season but be both enjoyable and insightful to those who are interested.
So where do we start? Let's look at results.
The season so far has been a bit of a mixed bag with one or two interesting results both home and away. The 5-1 win at home over Chorley provided us with an insight into the finishing and goalscoring ability Notts have within the squad and while the score flattered we by no means played the opposition off the park.
Equally who would have expected the 4-0 win away at Woking who at the time were one of the leagues form teams, likewise the defeat at home to Barrow was a big wake up call for all of us. If there is one thing we have learned so far it is that this league can be very unpredictable.
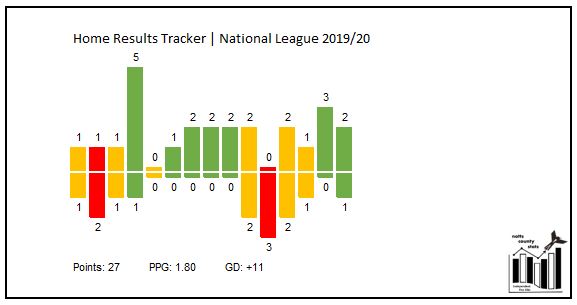
At the time of writing we have played 15 games at home in the league, won 7, drawn 6 and lost just 2 giving us a return of 27pts, a GD of +11 and an average 1.80 PPG.
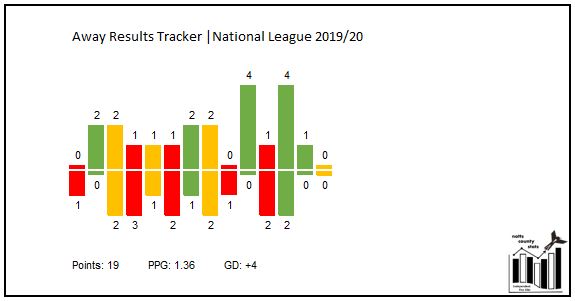
Away from home has been much more of a mixed bag, winning 5, drawing 4 and losing 5 giving a return of 19 points, a GD of +5 and an average 1.36 PPG.
If we take the above figures as a collective then Notts have a PPG for the season of 1.59. Assuming we continue at that rate for the remaining games then we would gain an additional 27 points and finish the season on 73 points which potentially might just see a play off spot.
As some of you already know I have been running a points tracker for much of the season that has given us a really good visual for progress and what is needed from a points perspective to ensure a play off spot.
Now that we are well into the second half of the season we have enough data to try and predict what will be needed to finish top, third or seventh but also have a good stab at final league position predictions.
Based on current form it would be difficult to bet against Barrow winning the league. If they continue at the rate they have been then they are predicted to finish on 90 points. Of course they could have a downturn in form but they already had a bad spell at the beginning of the season and have managed to keep a core 16-20 man squad fit and performing for most of the season and it would be hard to see that changing.
Top three is currently predicted at 80 points and a play off place 71 points. The complicating factor in all of this is that there are still 10 or 11 teams that will fancy their chances of a play off place and at least 6 teams fighting for a top 3 finish which in itself increases any margin for error as we could see many of these teams all fighting it out for the play off positions right up to the last game of the season.
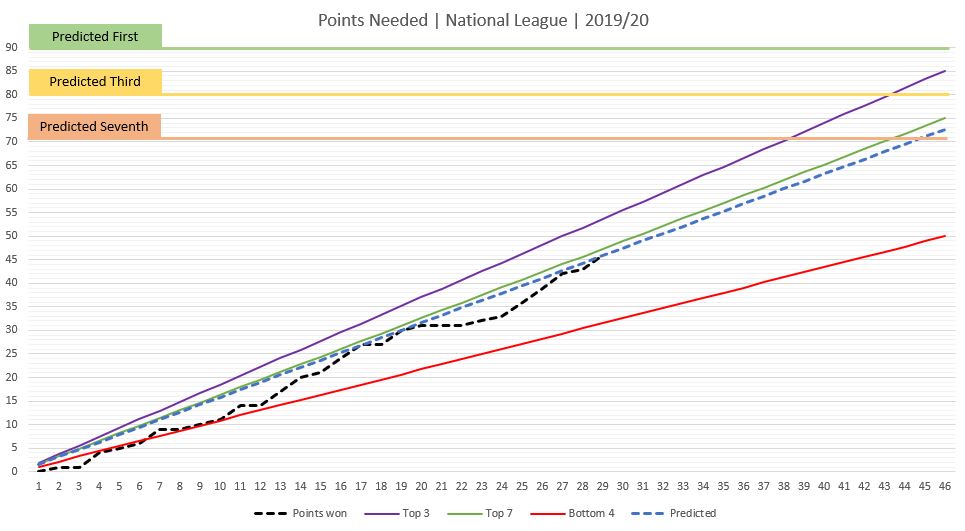
The graph below displays the current predicted points as well as the targets I set for play off spot (75pts) and top 3 (85 pts). Both of these targets were set earlier in the season and based on the final points achieved in the previous 6 National League seasons.
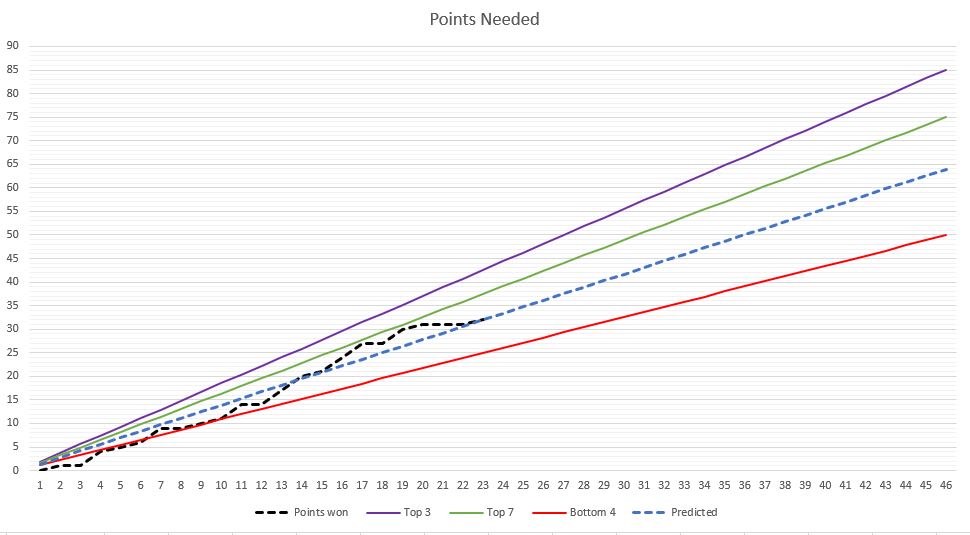
Regardless of the poor start and the midway dip in form progress has continued on an upward trajectory. This is further confirmed by looking back at previous charts, after match 11 we were barely going to scrape safety and predicted 46 points. The chart below is from match 23, just 6 league games ago and a predicted finish of 65 points, 8 points less than the current prediction. We should take some comfort from that.
I will update and publish the chart after every league game so we can continue to track our progress against targets and predicted points.
Next I want to look at some metrics that measure our attacking efficiency and also our defensive resilience.
Normally xG data would be utilised to determine how effective we are in attacking and defensive phases but as mentioned earlier there is very little reliable xG data available for me to work with at this time.
To get past this I have used shots on goal vs goals scored to identify how effective or resilient we have been in any given game.
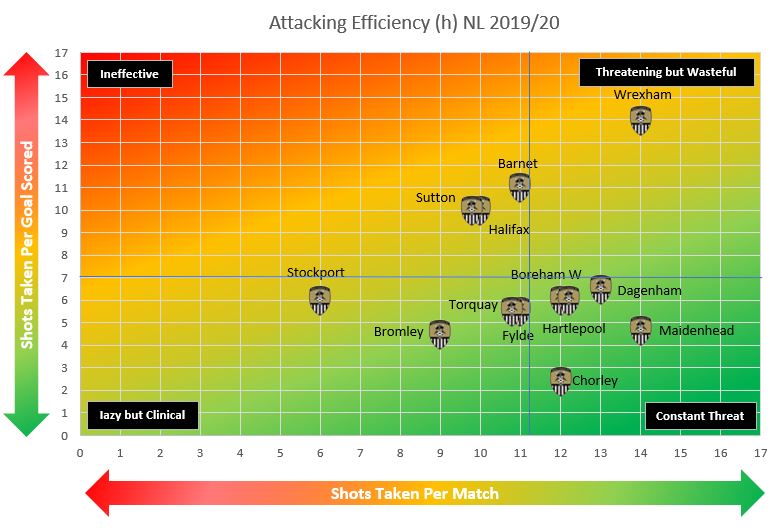
When looking at attacking efficiency we can determine whether we are clinical or wasteful in front of goal. In the two charts below we assess this efficiency both at home and away.
In this chart we can see why our home record is better and more consistent than our away record. The bottom right corner of the chart is where you would like to see yourself in most games. This would indicate you are a constant threat by the number of shots taken. The 'y' value represents the number of shots it takes to score a goal so take Chorley as one example and you can see we were extremely clinical scoring a goal every 2.5 shots. However when you look at Wrexham we had more shots but only managed to convert one so making us very wasteful.
The horizontal and vertical lines represent the average values for the data in the chart.
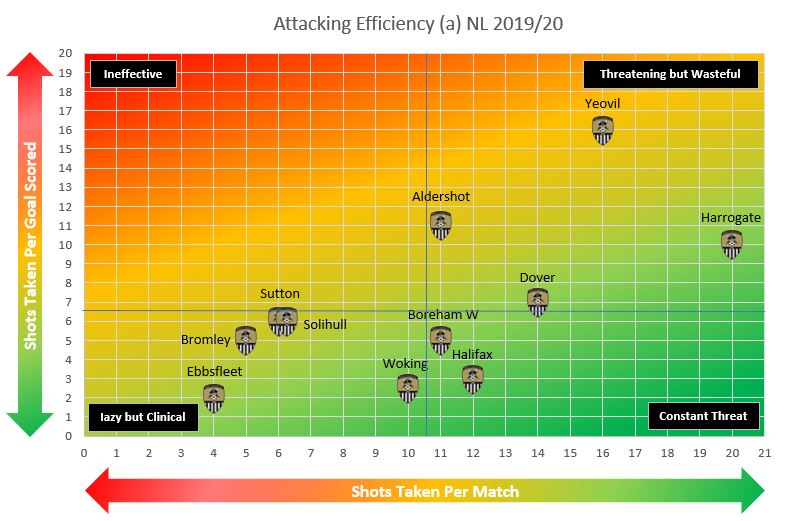
By contrast the away chart tells a slightly different story. We spent more games over to the left of the chart indicating we were less of a threat in those games. It was commonly thought that we should have come away with something in the 3-1 defeat at Yeovil and the chart would seem to back this up with just the one goal scored in 16 attempts.
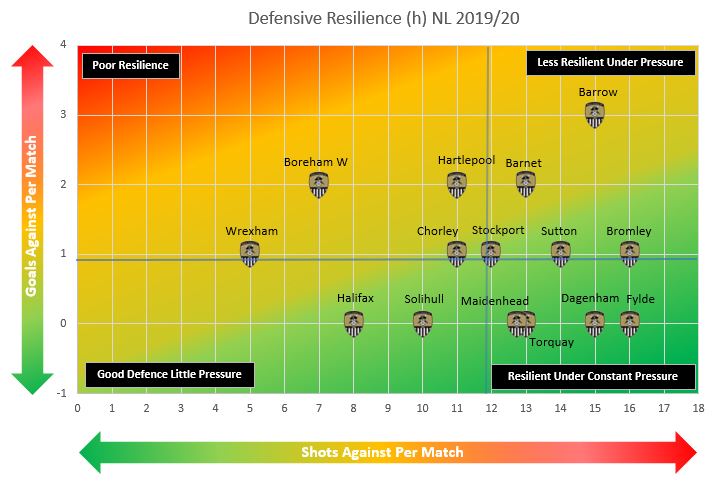
When we look at defensive resilience we again have to look at goals faced vs goals conceded to determine a value that is representative of the match in question.
Again there is a clear difference between home and away games. As with the other charts the sweet spot is bottom right and the majority of home games are gravitating that way with the Barrow game being the standout negative.
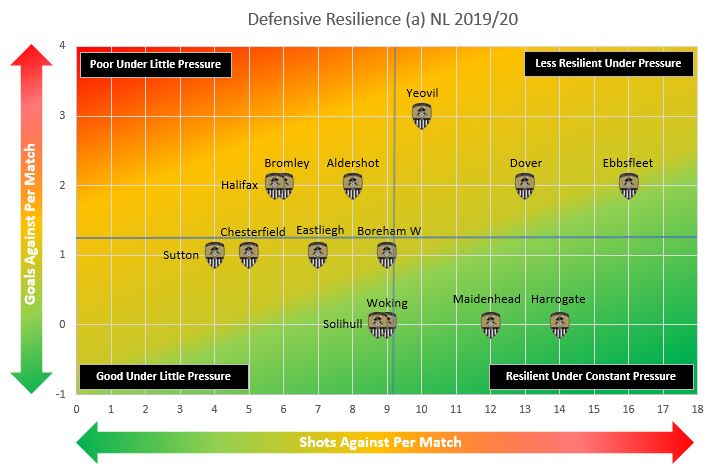
Away from home there appears a bit more of a pull to the left of the chart which would indicate a less resilient defence. Interesting again to mention Yeovil where we allowed them to score pretty much every third shot at goal.
Hopefully you have found this interesting. I will continue to work on new metrics and research other data sources to try and bring as much insightful content as possible. It really would help though if we could get back into the league so I can start to get my hands on some decent data!
In the meantime please feel free to comment and share. I'm conscious of the fact that I am quite new to this myself so may be missing something obvious and therefore happy for any feedback that will help to grow and develop the site and its content.
COYP!