If someone had told you Notts were going to win 5-0 away from home on opening day you would be forgiven for thinking they may be a few sarnies short of a picnic.
However, a rampant Magpies team resplendent in mint green and charcoal laid down a marker for the Hollywood big spenders and furlough beneficiaries that suggested despite their marquee signings they are not going to have it all their own way this season.
Of course, we were playing a team undergoing massive transition, ending last season at the bottom of the National League pile and new boss Harry Kewell with his work cut out, looking to make a silk purse out of a pigs ear during the coming campaign. But you can only play what stands in front of you and if you are to believe Ruben Rodrigues in his post match interview The Bees were very lucky that their floodgate's weren't breach until the second half.
Anyway onto the stats and I'll be doing things a little differently this season. xG will obviously feature heavily but I've streamlined some of the other stats to make it less labour intensive.
Additionally I will be doing a stats based player feature after every game and you will be able to have an input into who that is.
Key match stats below and you can see there is a lot more to digest!
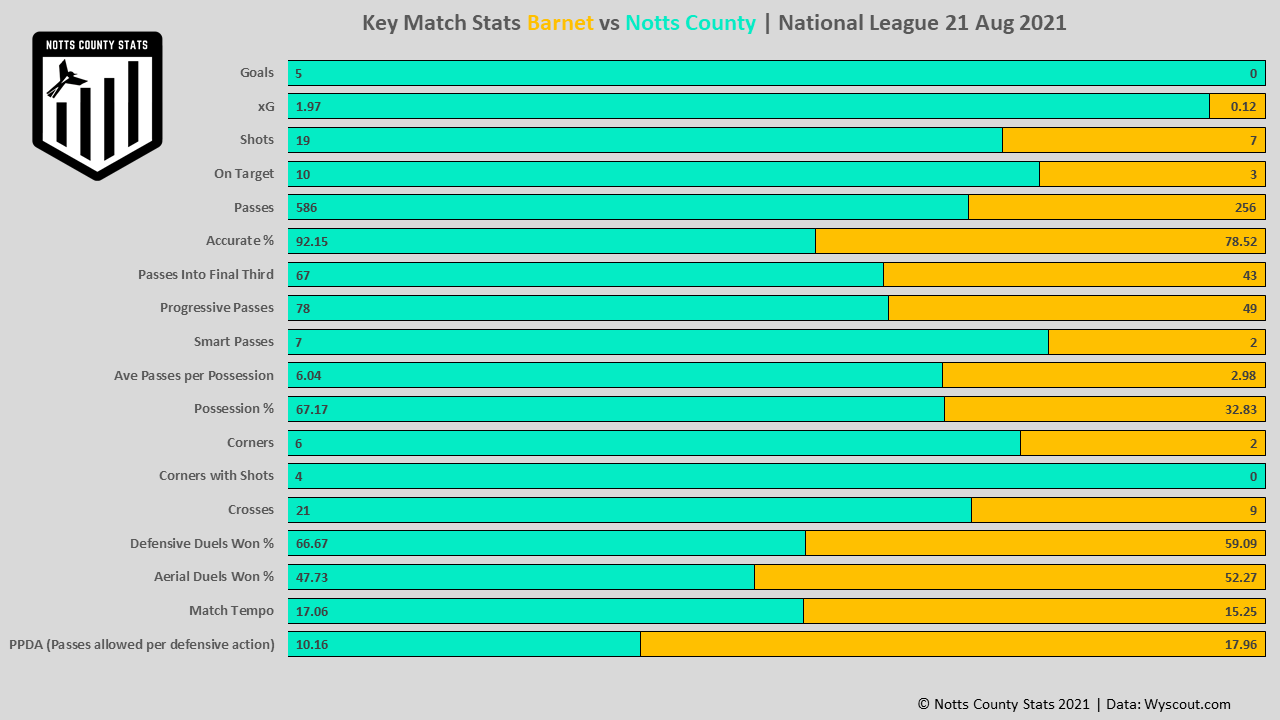
A few things to consider when trying to decipher the chart above.
Corners now also display corners that resulted in an attempt (shot) at goal. What is promising from this first game is that Notts actually managed 4 attempts on goal from 6 corners and Barnet had no attempts on goal from just 2 corners.
As well as possession we can now assess the average number of passes per possession.
When looking at passes we can see how accurate those passes were and how many progressive and smart passes were made as well as passes into the final third. This again provides metric's to enable us to assess the effectiveness of attacking play.
Match tempo is an indication of how quickly a team moves the ball in an attacking or progressive build up. This is something we should keep an eye on as it is something Ian Burchnall has mentioned in interviews and obviously plays a big part in his desired style of play.
To give you an idea the average match tempo for Notts in 2019/20 under Neal Ardley was 15.48. We can see that this metric is improved for the Barnet game.
Finally PPDA. This is the number of passes you allow the opposition when defending. If you are operating a high press you can keep that number quite low. if you tend to sit back and invite pressure then that value will become higher. As we can see from the chart Notts restricted Barnet to just 10.16 passes per defensive action whereas Barnet, probably due to the sending off found themselves allowing Notts more time on the ball when defending a Notts attack.
Player stats next and this is the new table that is also available to view on the player stats page of the website here.
This season I will also be including every minute played so all minutes of added time will be included.
Goals and assists chart below, it's quite sobering to think I had nothing to show in this respect after the first game last season.
Also, what a way to re-introduce the goal scatter visual! As usual, hover over the dots to get information relating to that goal.
Onto xG now and I've decided to make things simpler I will include penalties in the visuals but some of the stats used to assess certain actions may not include penalty goals but this will be made clear at the time.
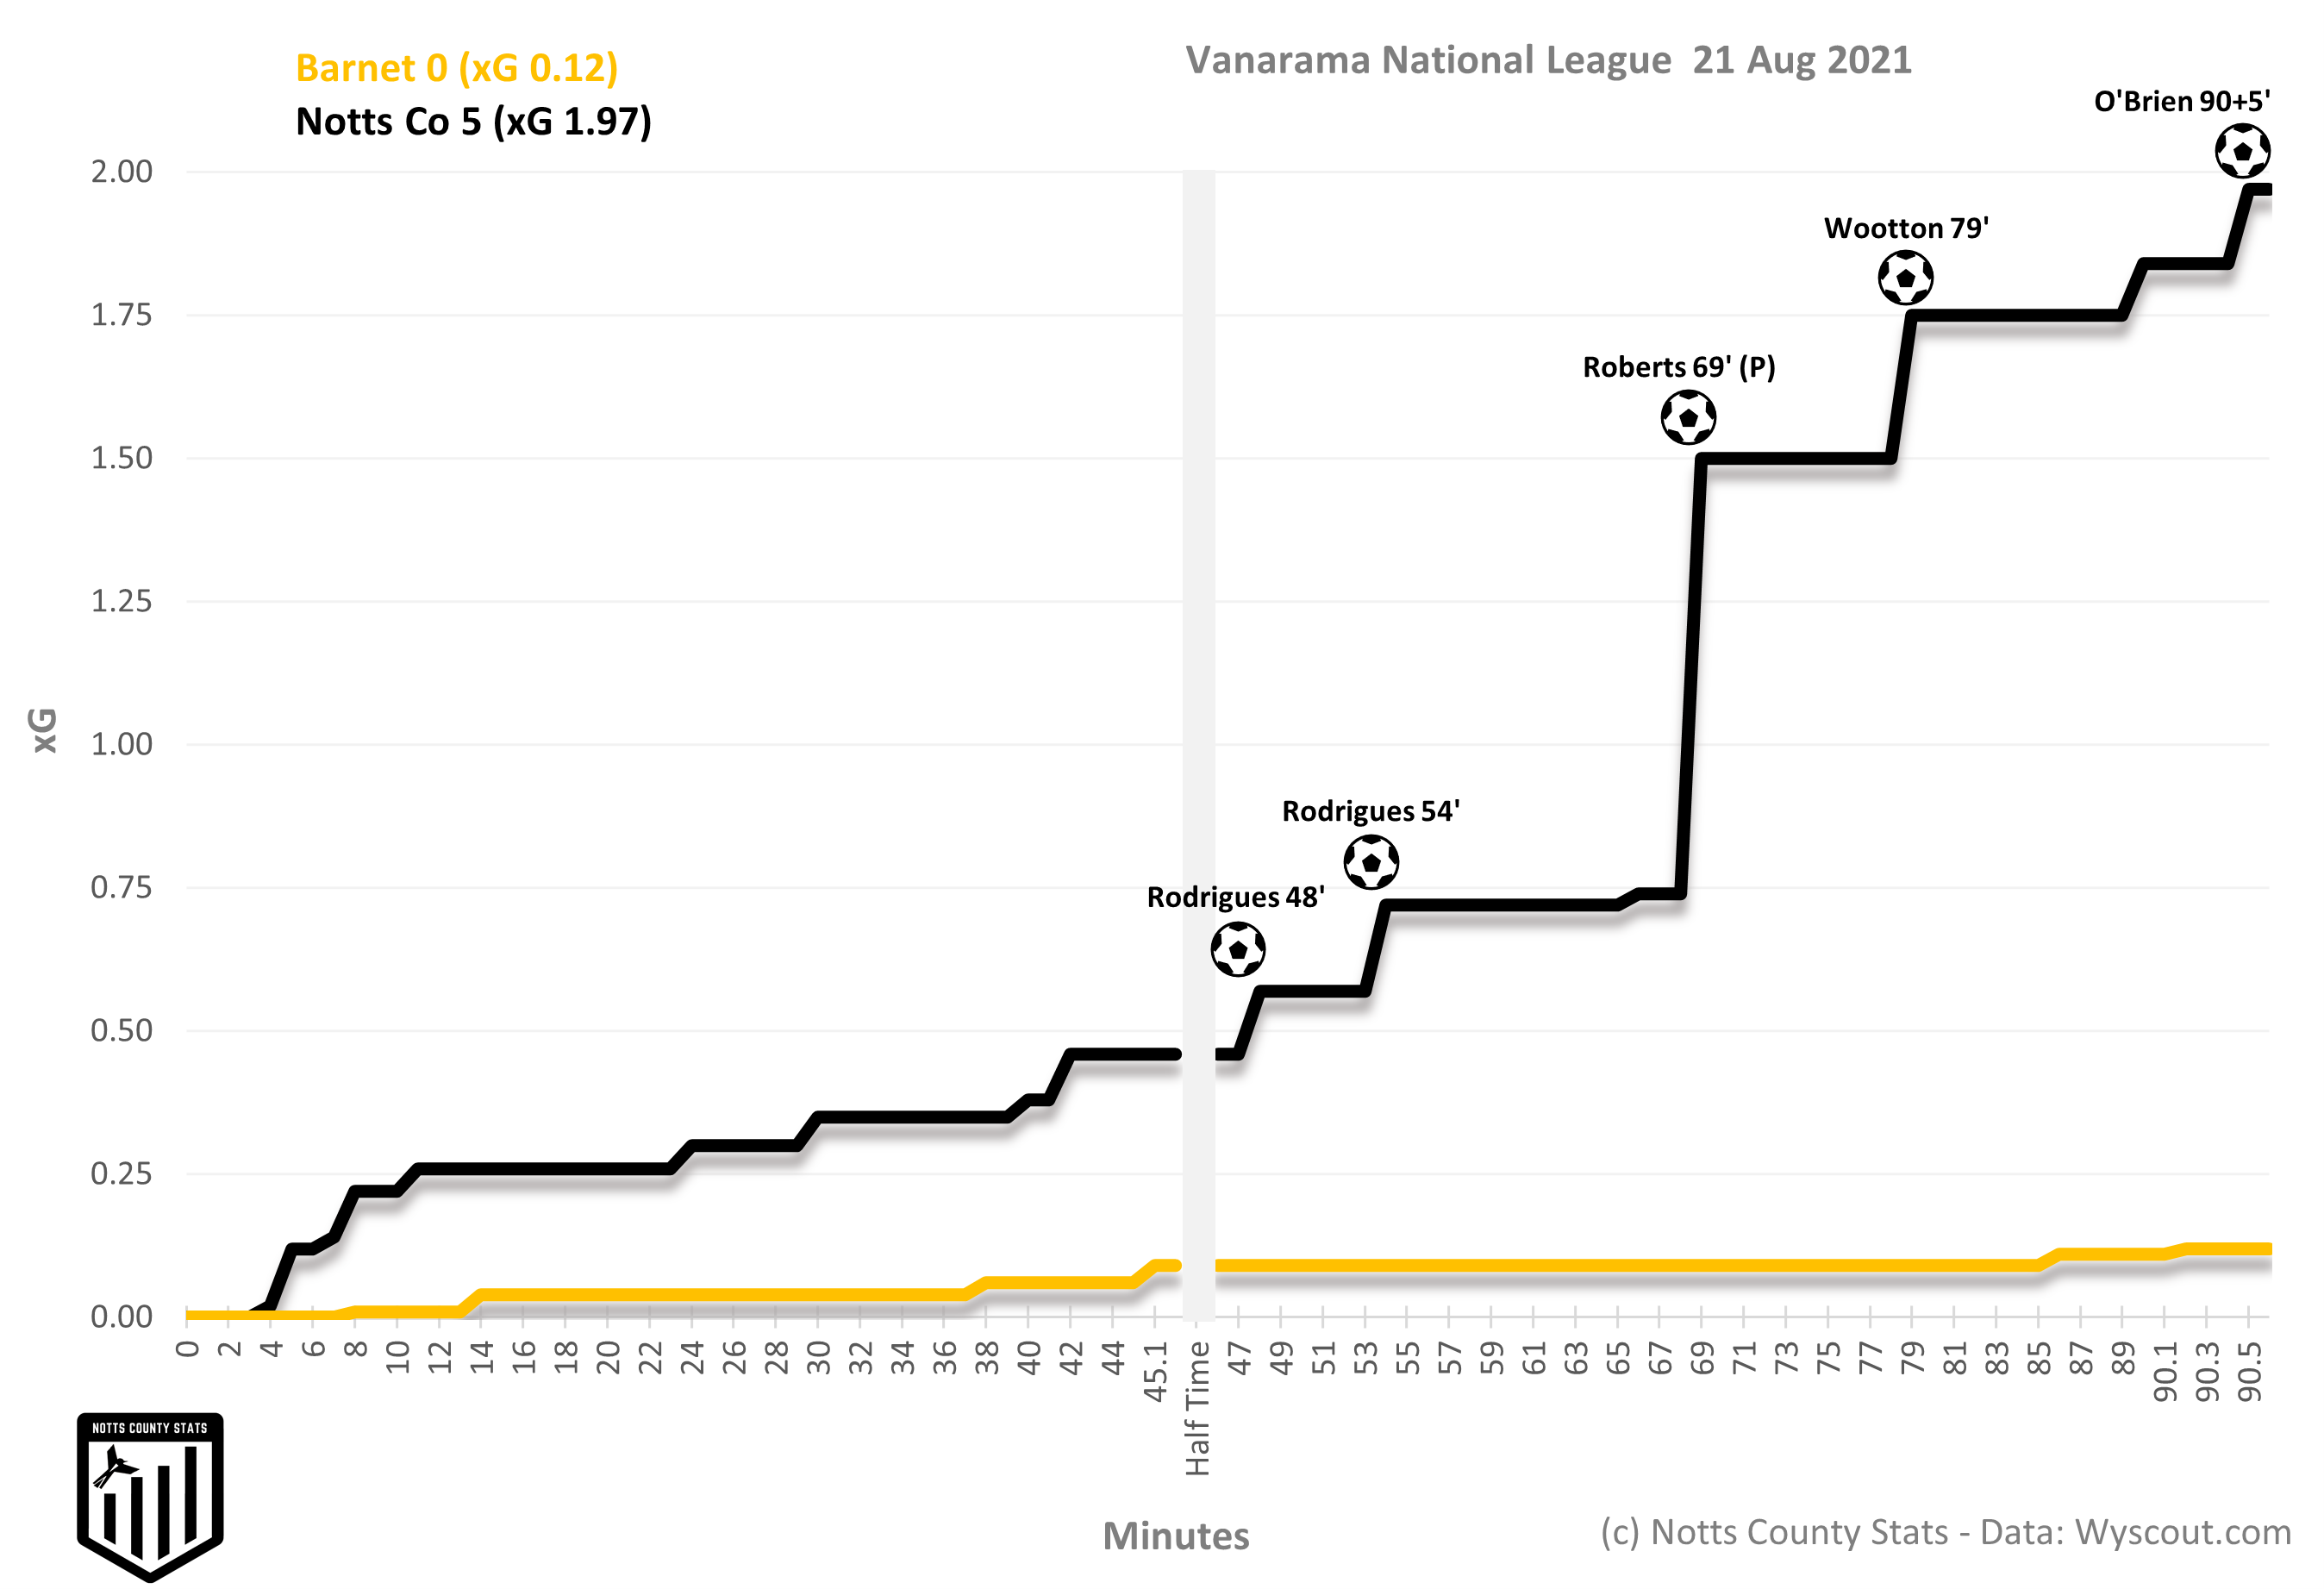
As we can see the early second half goal saw Notts up their game a bit and at last we were treated to the sort of ruthlessness we have been starved of from a Notts team for some time.
Based on the xG including the penalty goal xPTS for Notts was 2.94 and win% estimated at 98%.
Without the penalty the xPTS for Notts would be 2.30 and 79.67 win%.
Player xG below.
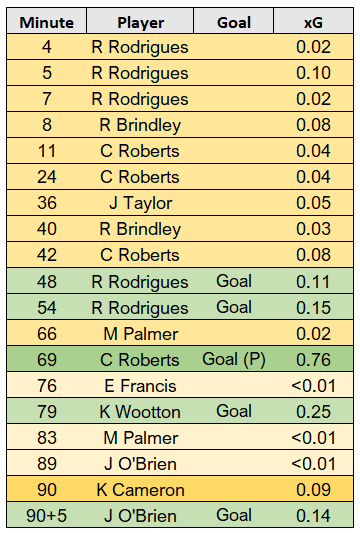
It's nice to see attempts on goal coming from all over the pitch including both the midfield and the back three.
A new feature now where we take a closer look at a player stats for the game in question and the first one could be no other than Ruben Rodrigues.
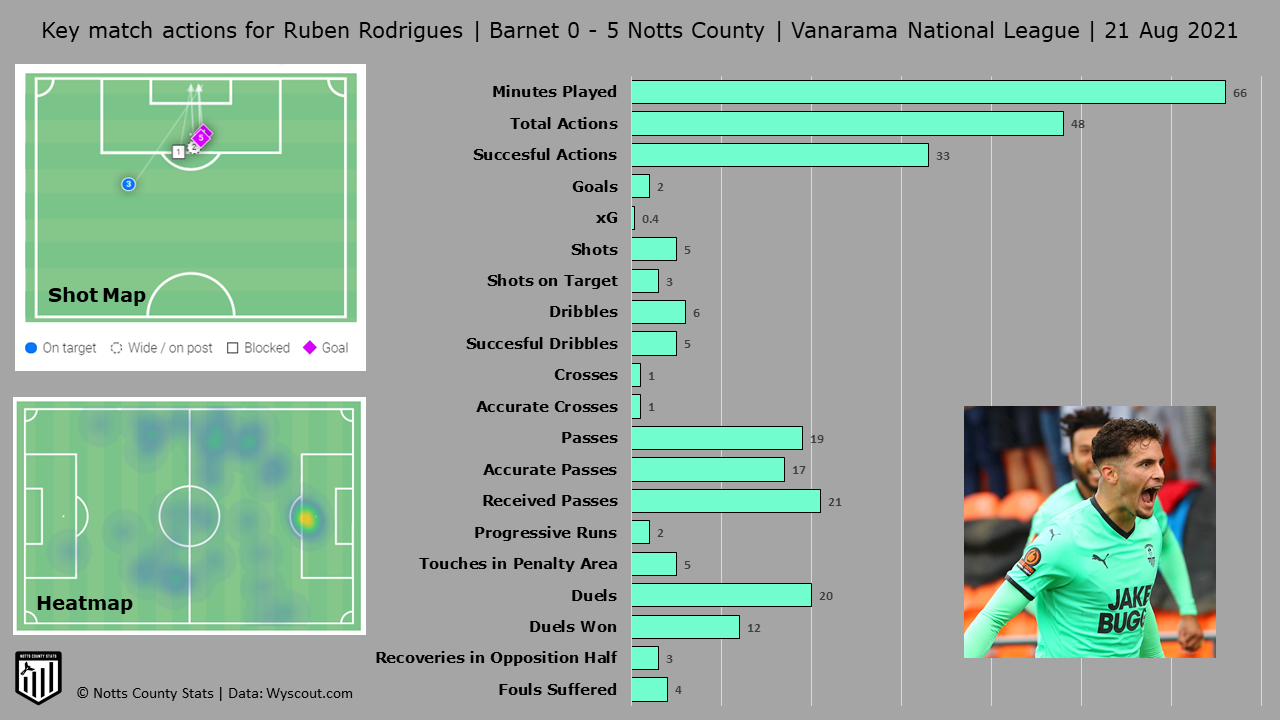
It's fair to say the Portuguese playmaker packed a fair bit into his 66 minutes on the pitch.
I'll be running a Twitter poll after each game to see who we feature.
National League goal scorers after Matchday 1. I've put them in order of least minutes per goal but you can click on the column headers to sort and use the search bar to highlight individual players.
Over the next few weeks I will introduce tables showing top assists and goals + assists.
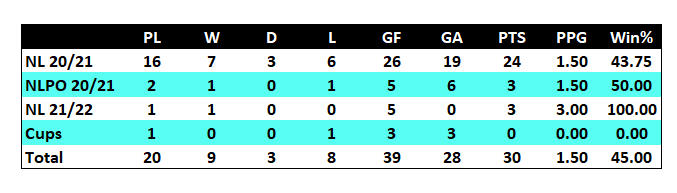
Finally Ian Burchnall's record updated after 20 matches.
Next up Torquay at Meadow Lane for Notts' first game of the season in front of the home fans. Preview to follow shortly.
Hope you've enjoyed the new content, I'm sure it will develop further as the season progresses. Remember to have a scout around the website as well where you will find all the usual tables and stats.
As always thanks for reading.
Until next time.
COYP!
Richard