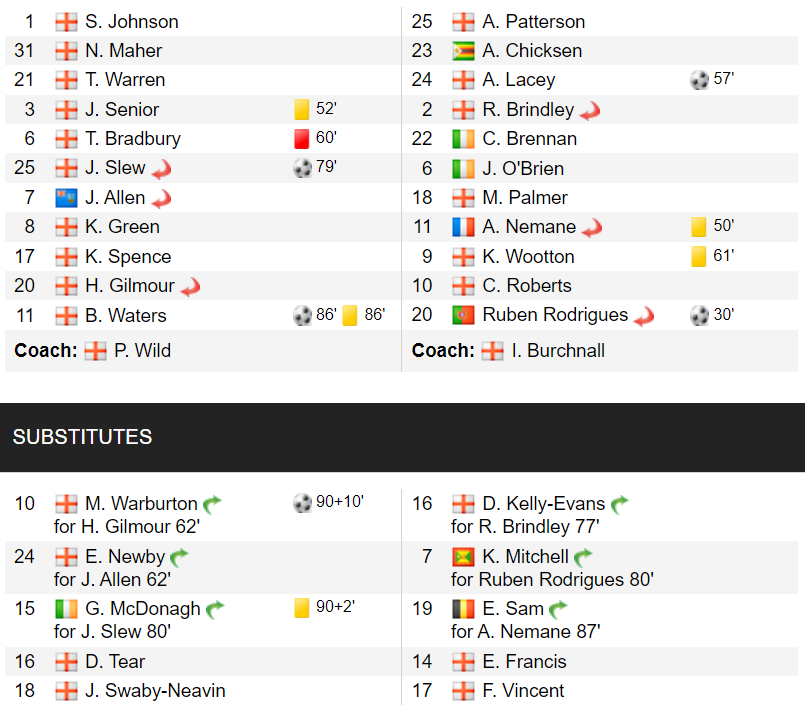
Line-up's
As with the last report, no need to go over old ground, so much mud being flung around I'd rather not contribute to the diatribe. Here's the stats . . .
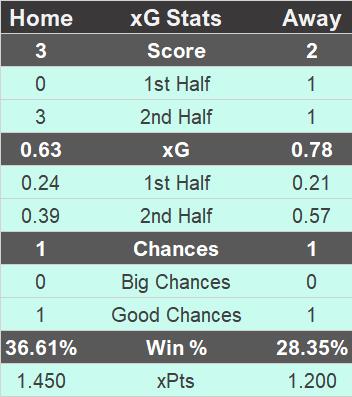
Key match stats.
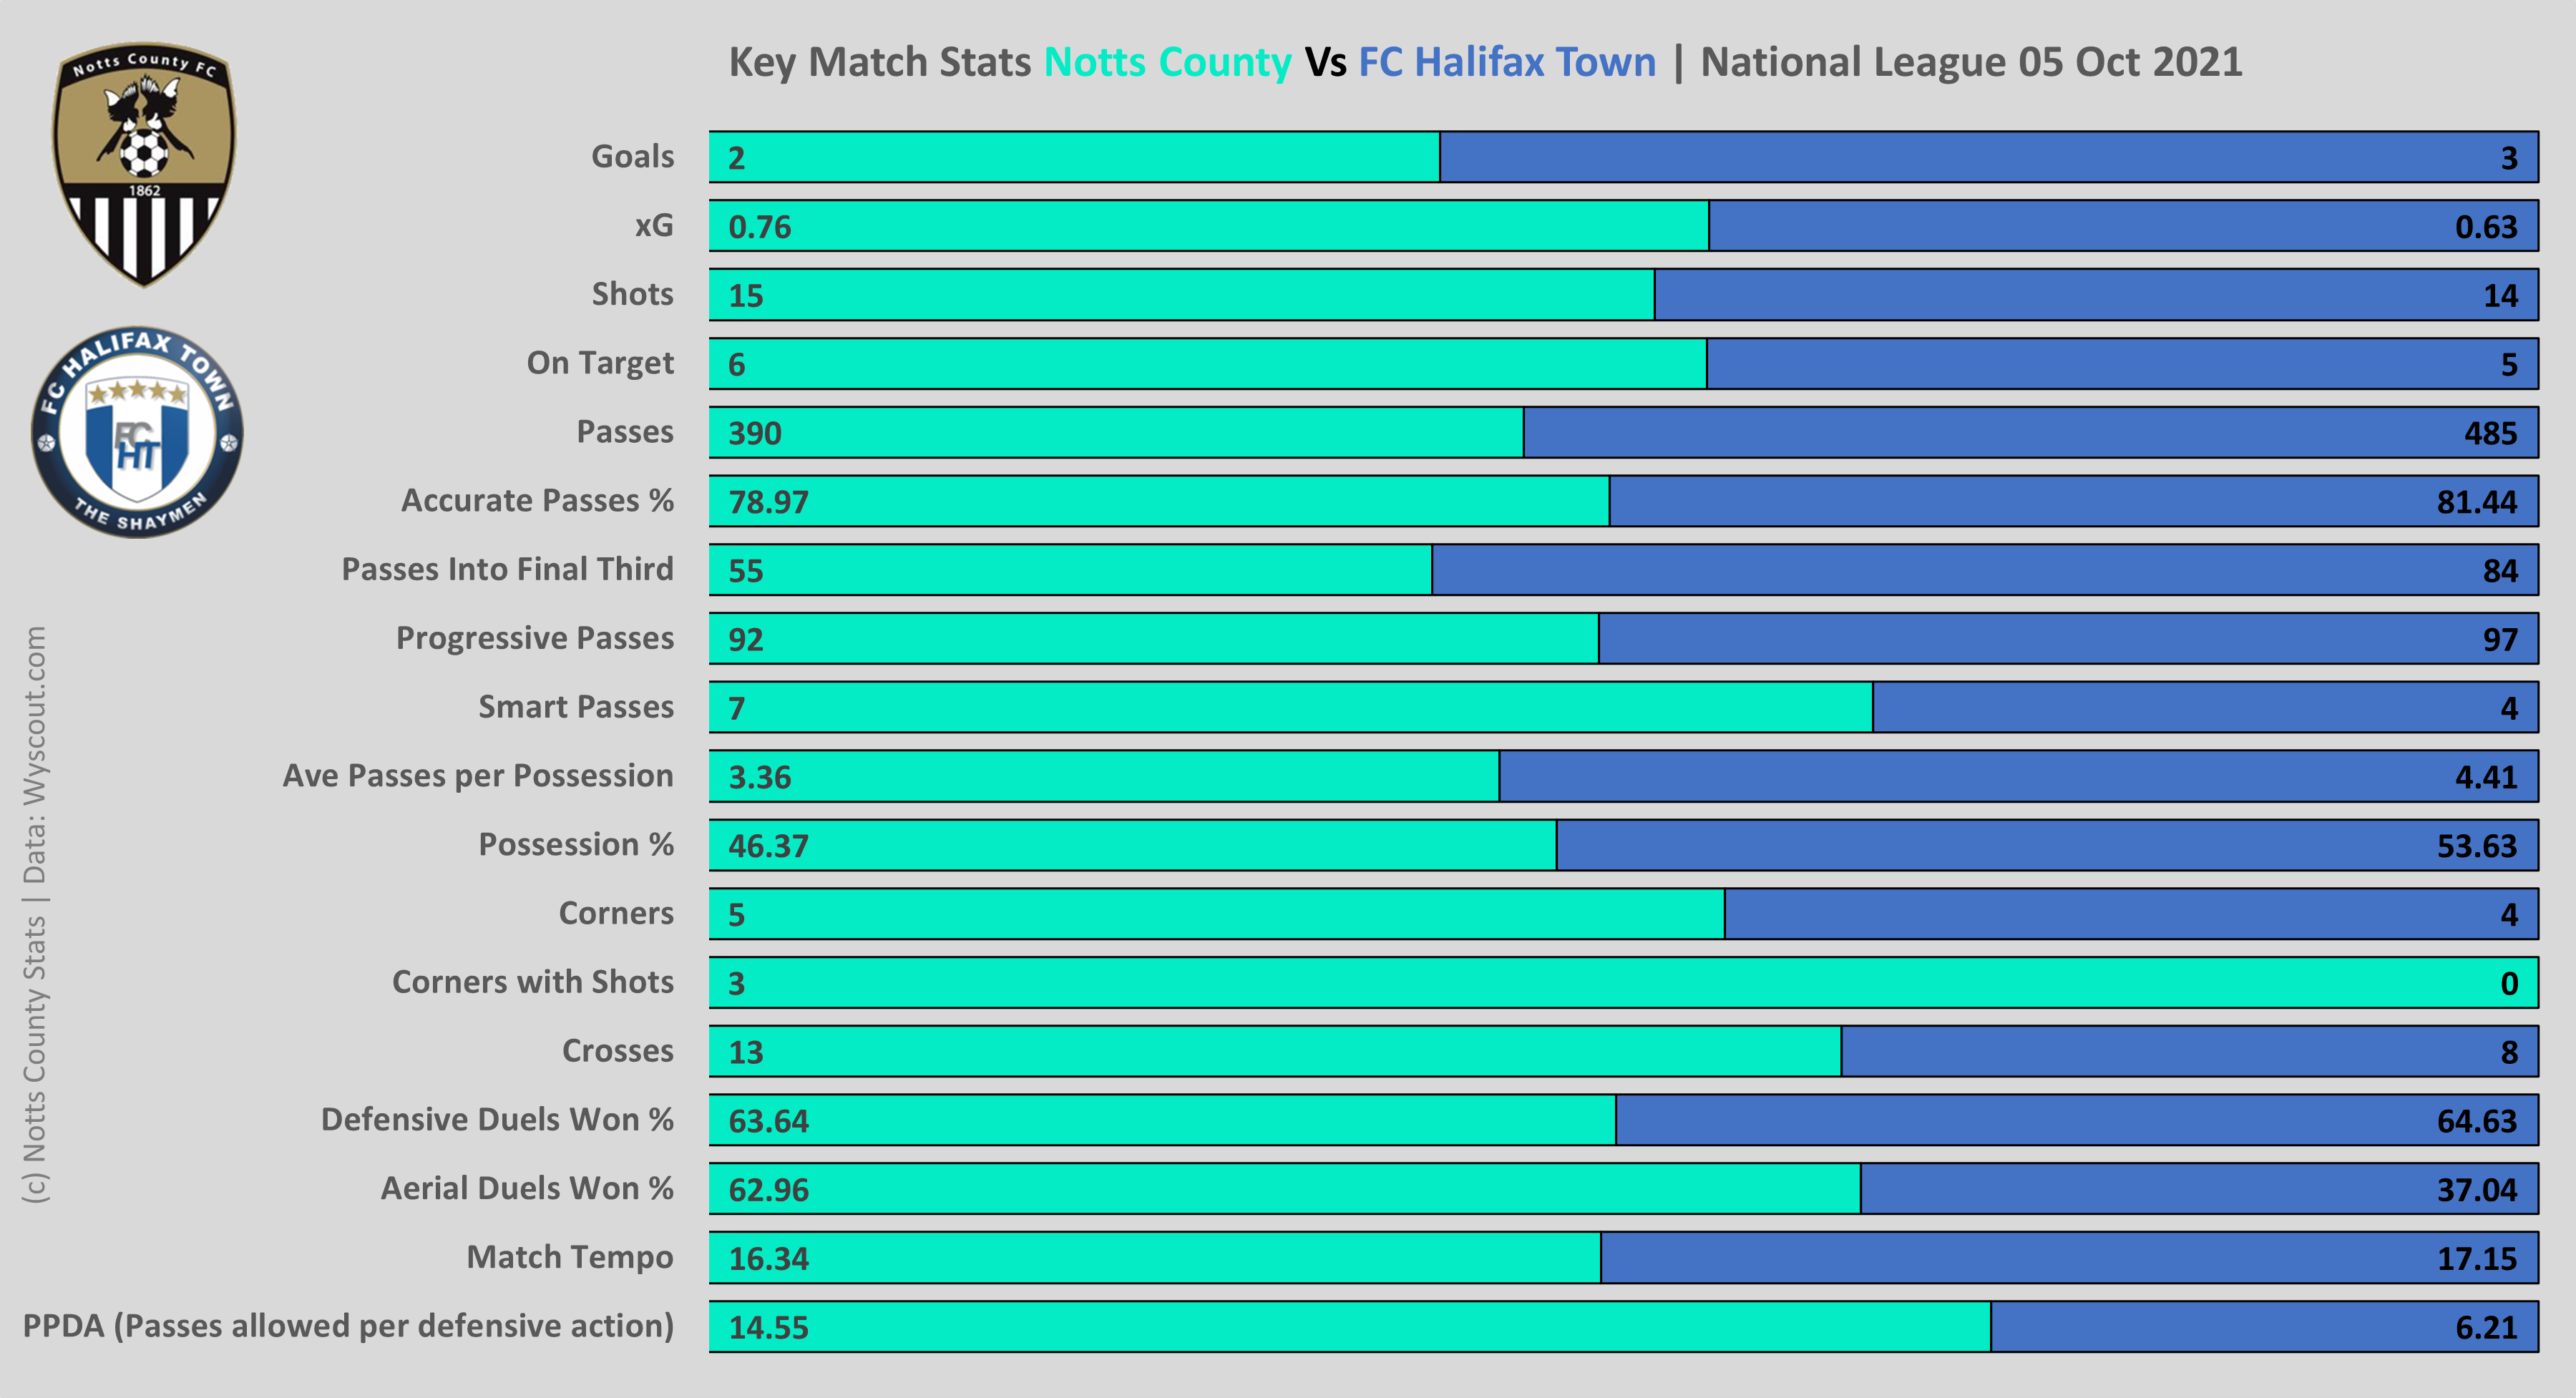
Interesting to see from the above that Halifax actually had more possession, made more passes, played a higher tempo and reduced Notts to an average 6.21 passes per attack. I'm pretty sure that's the first time that has happened this season, maybe with the exception of Wrexham away.
Points needed updated. Click on the legend tags at the top to filter options.
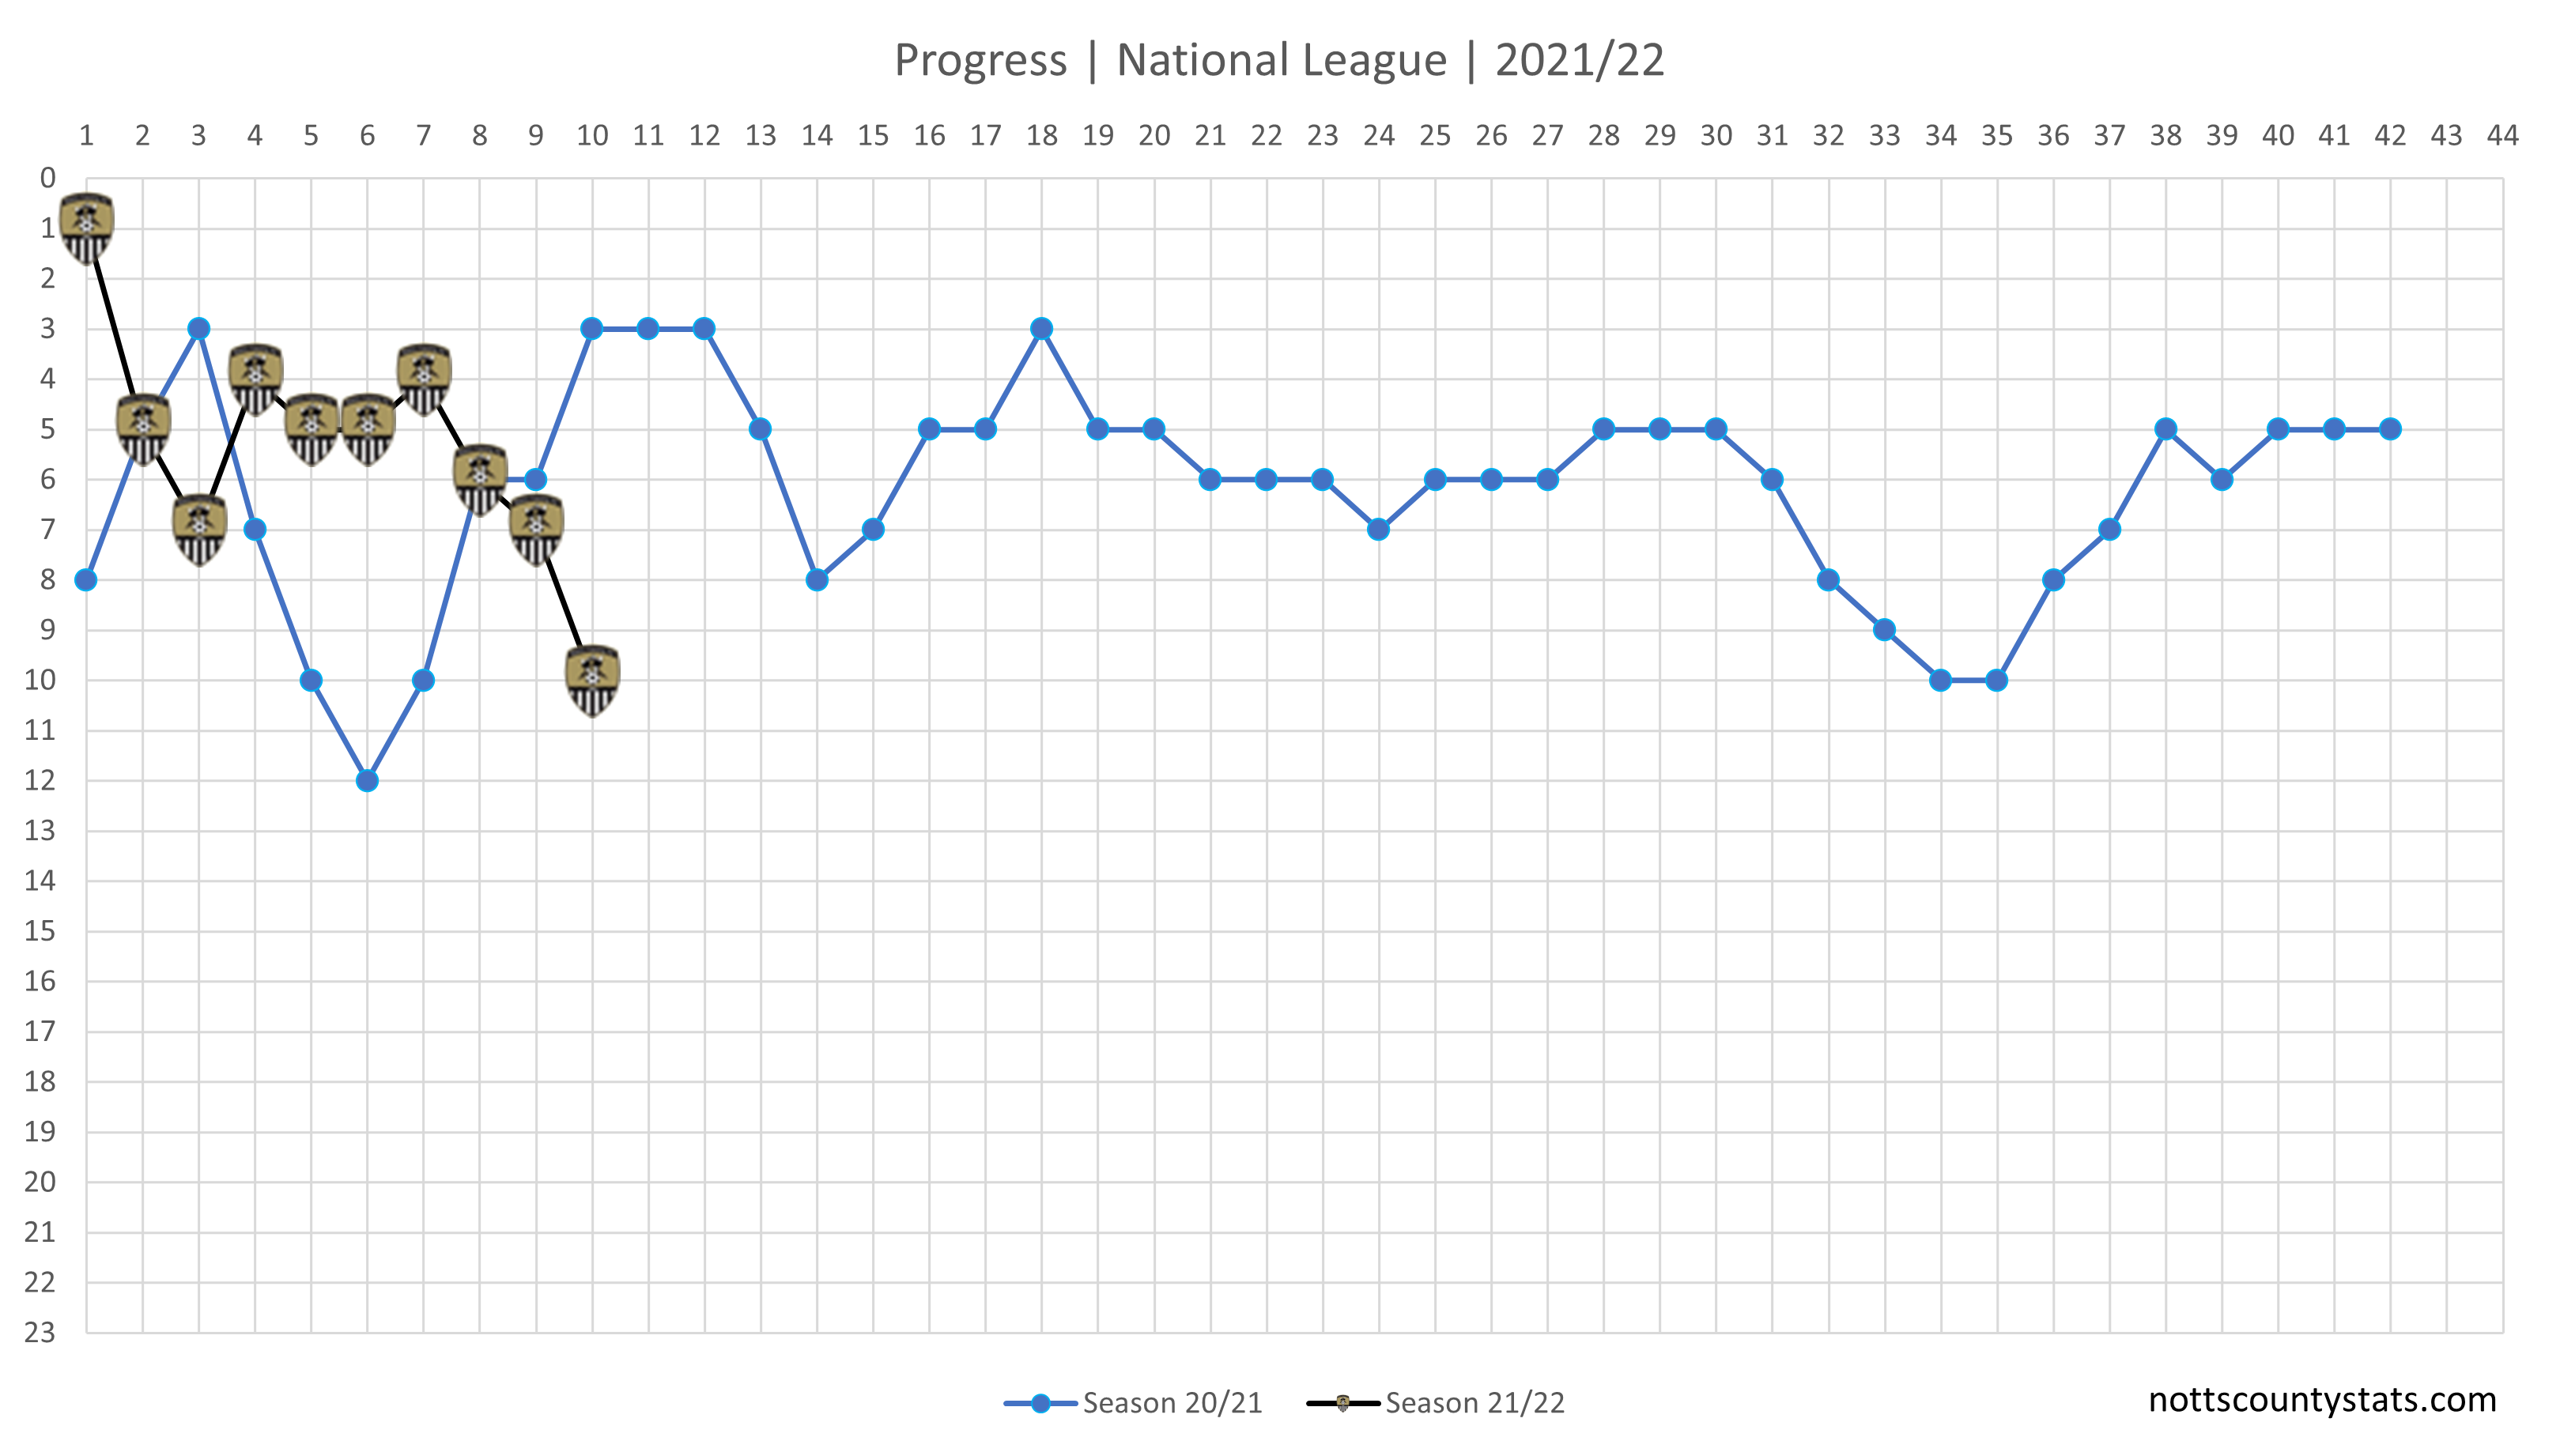
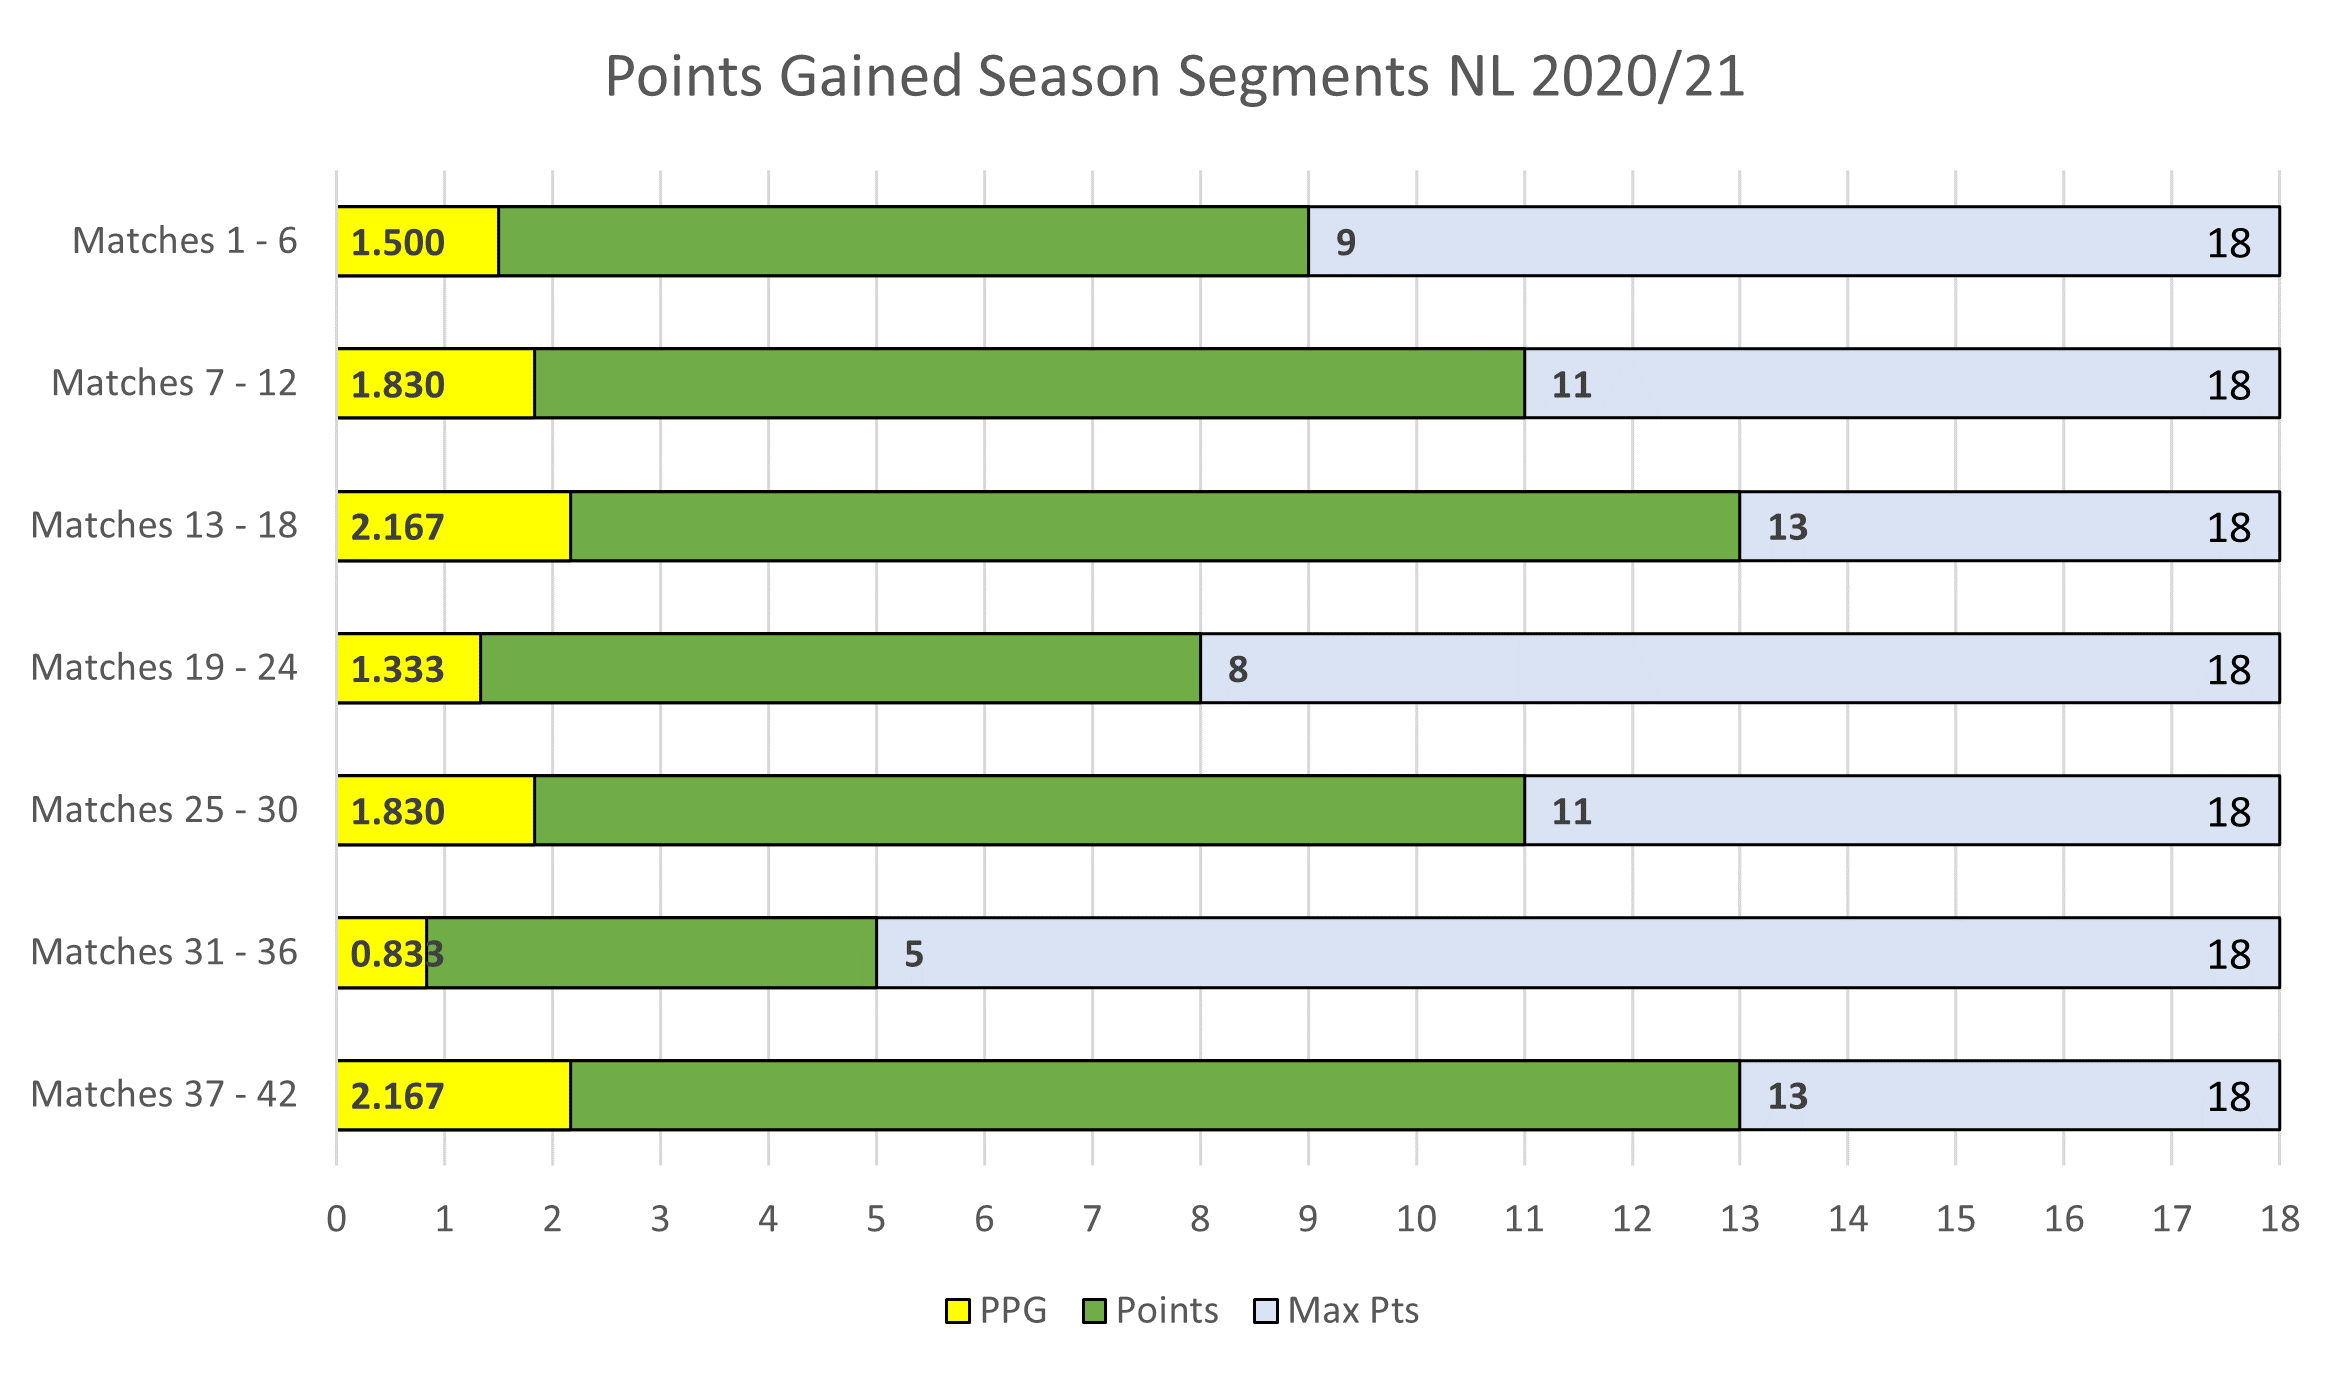
Progress updated. Perhaps best to turn it upside down!
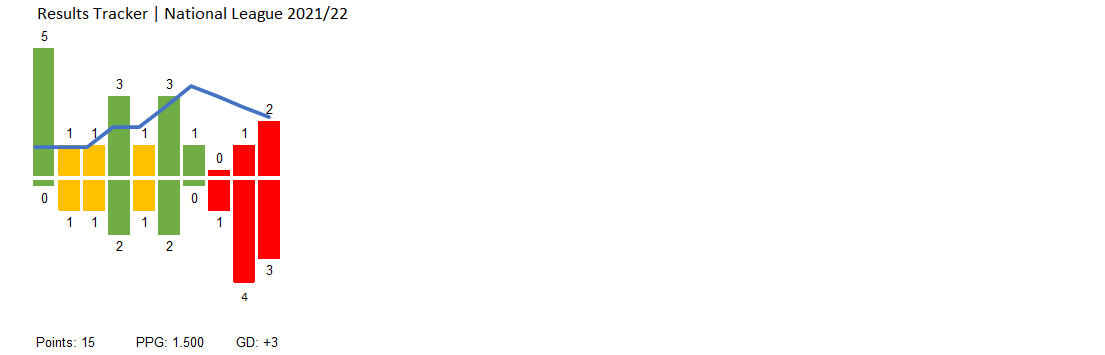
Results tracker updated. Really not a fan of anything in red.
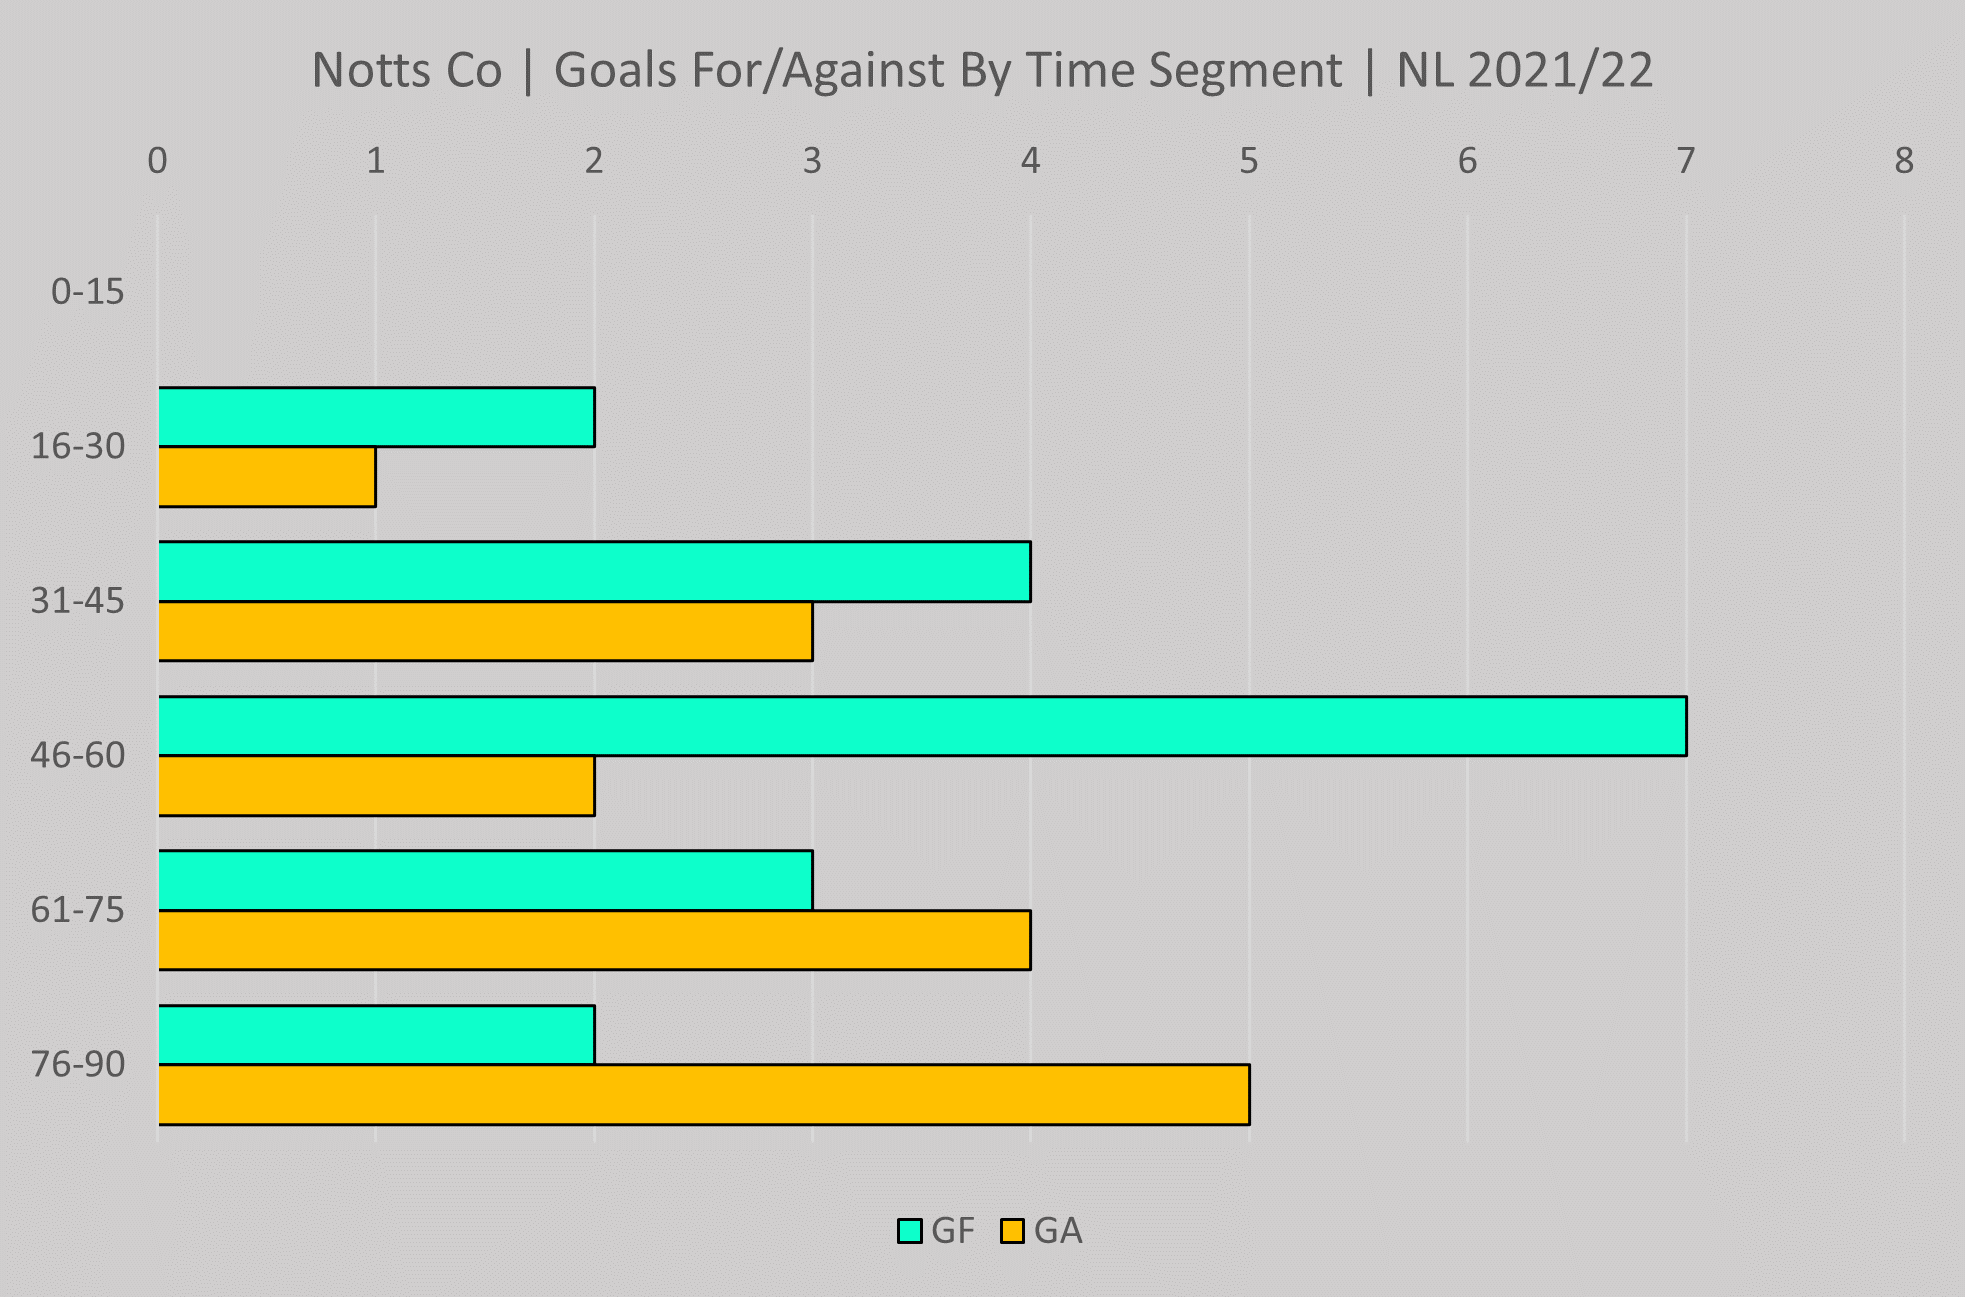
Goal segment chart updated. The second half goals against is looking a bit unsettling.
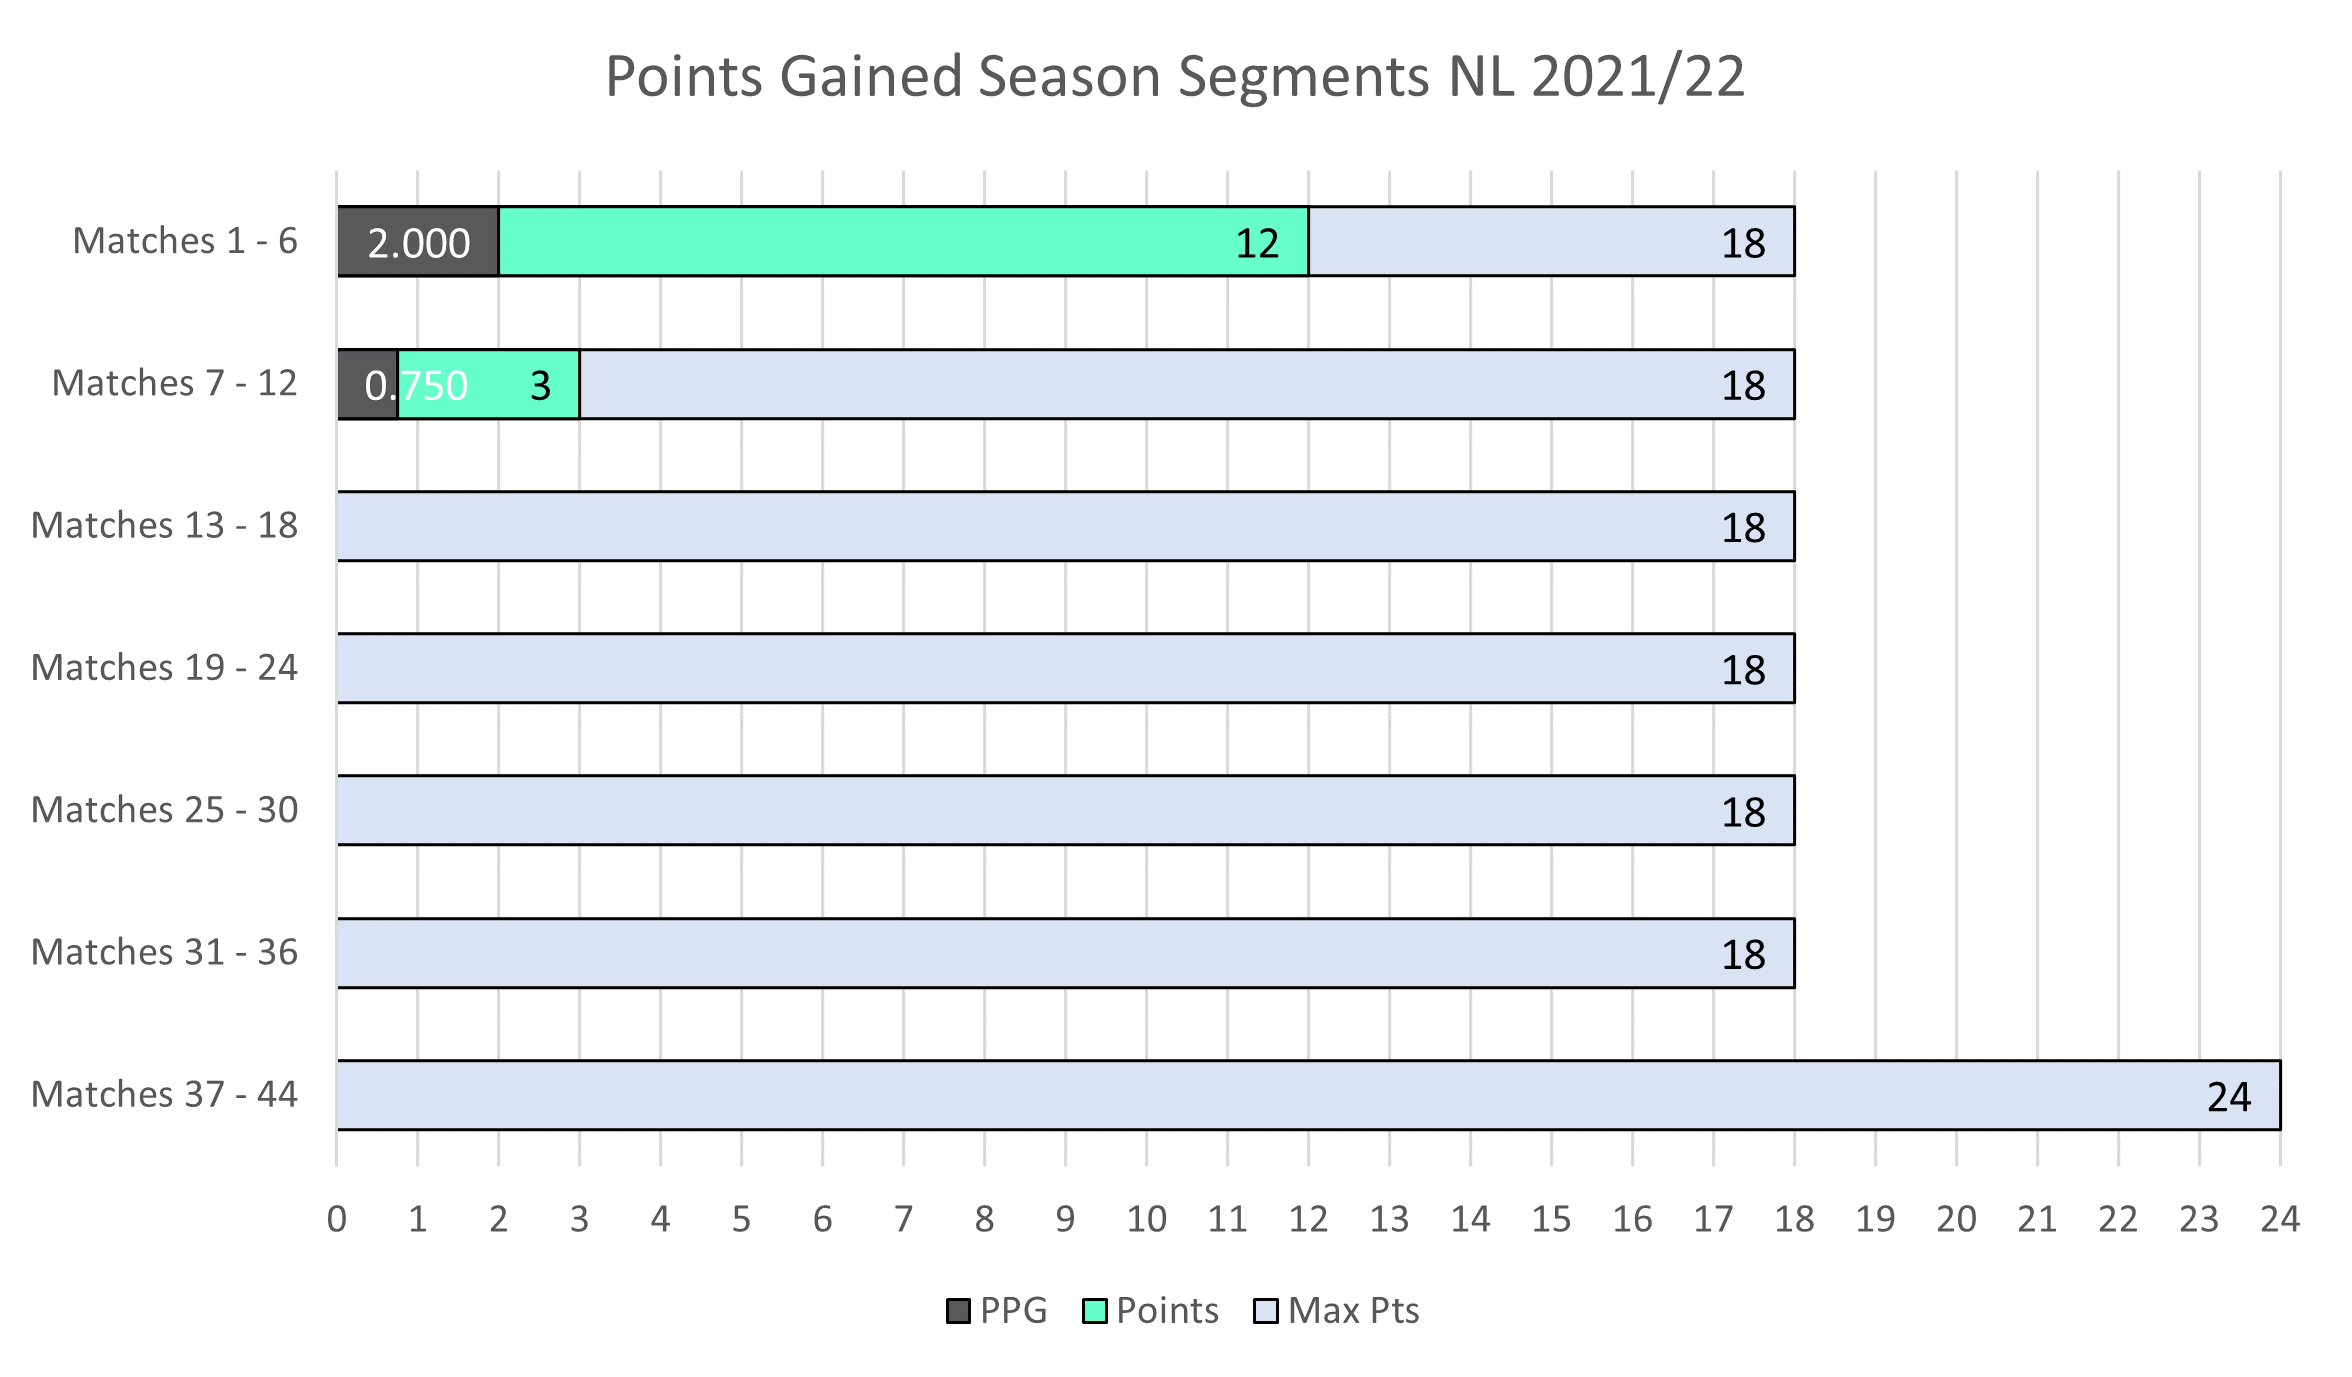
Six game segments updated. With 4 of the 6 games played in this segment the best Notts can do is 9 points but that means winning the next two games.
Player stats next and this is the new table that is also available to view on the player stats page of the website here.
Goals and assists chart updated. Not yet convinced they're the best on earth but Ruben and Roberts are certainly battling it out in the goal contribution table.
Goal scatter chart.
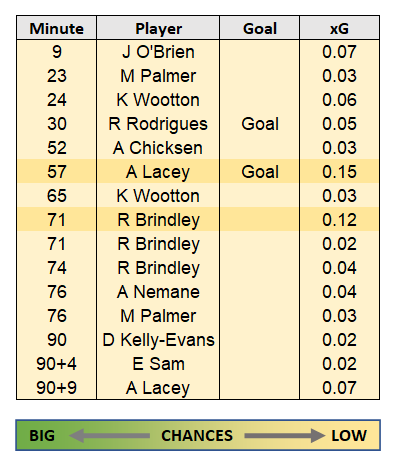
Expected goals for the Halifax game.
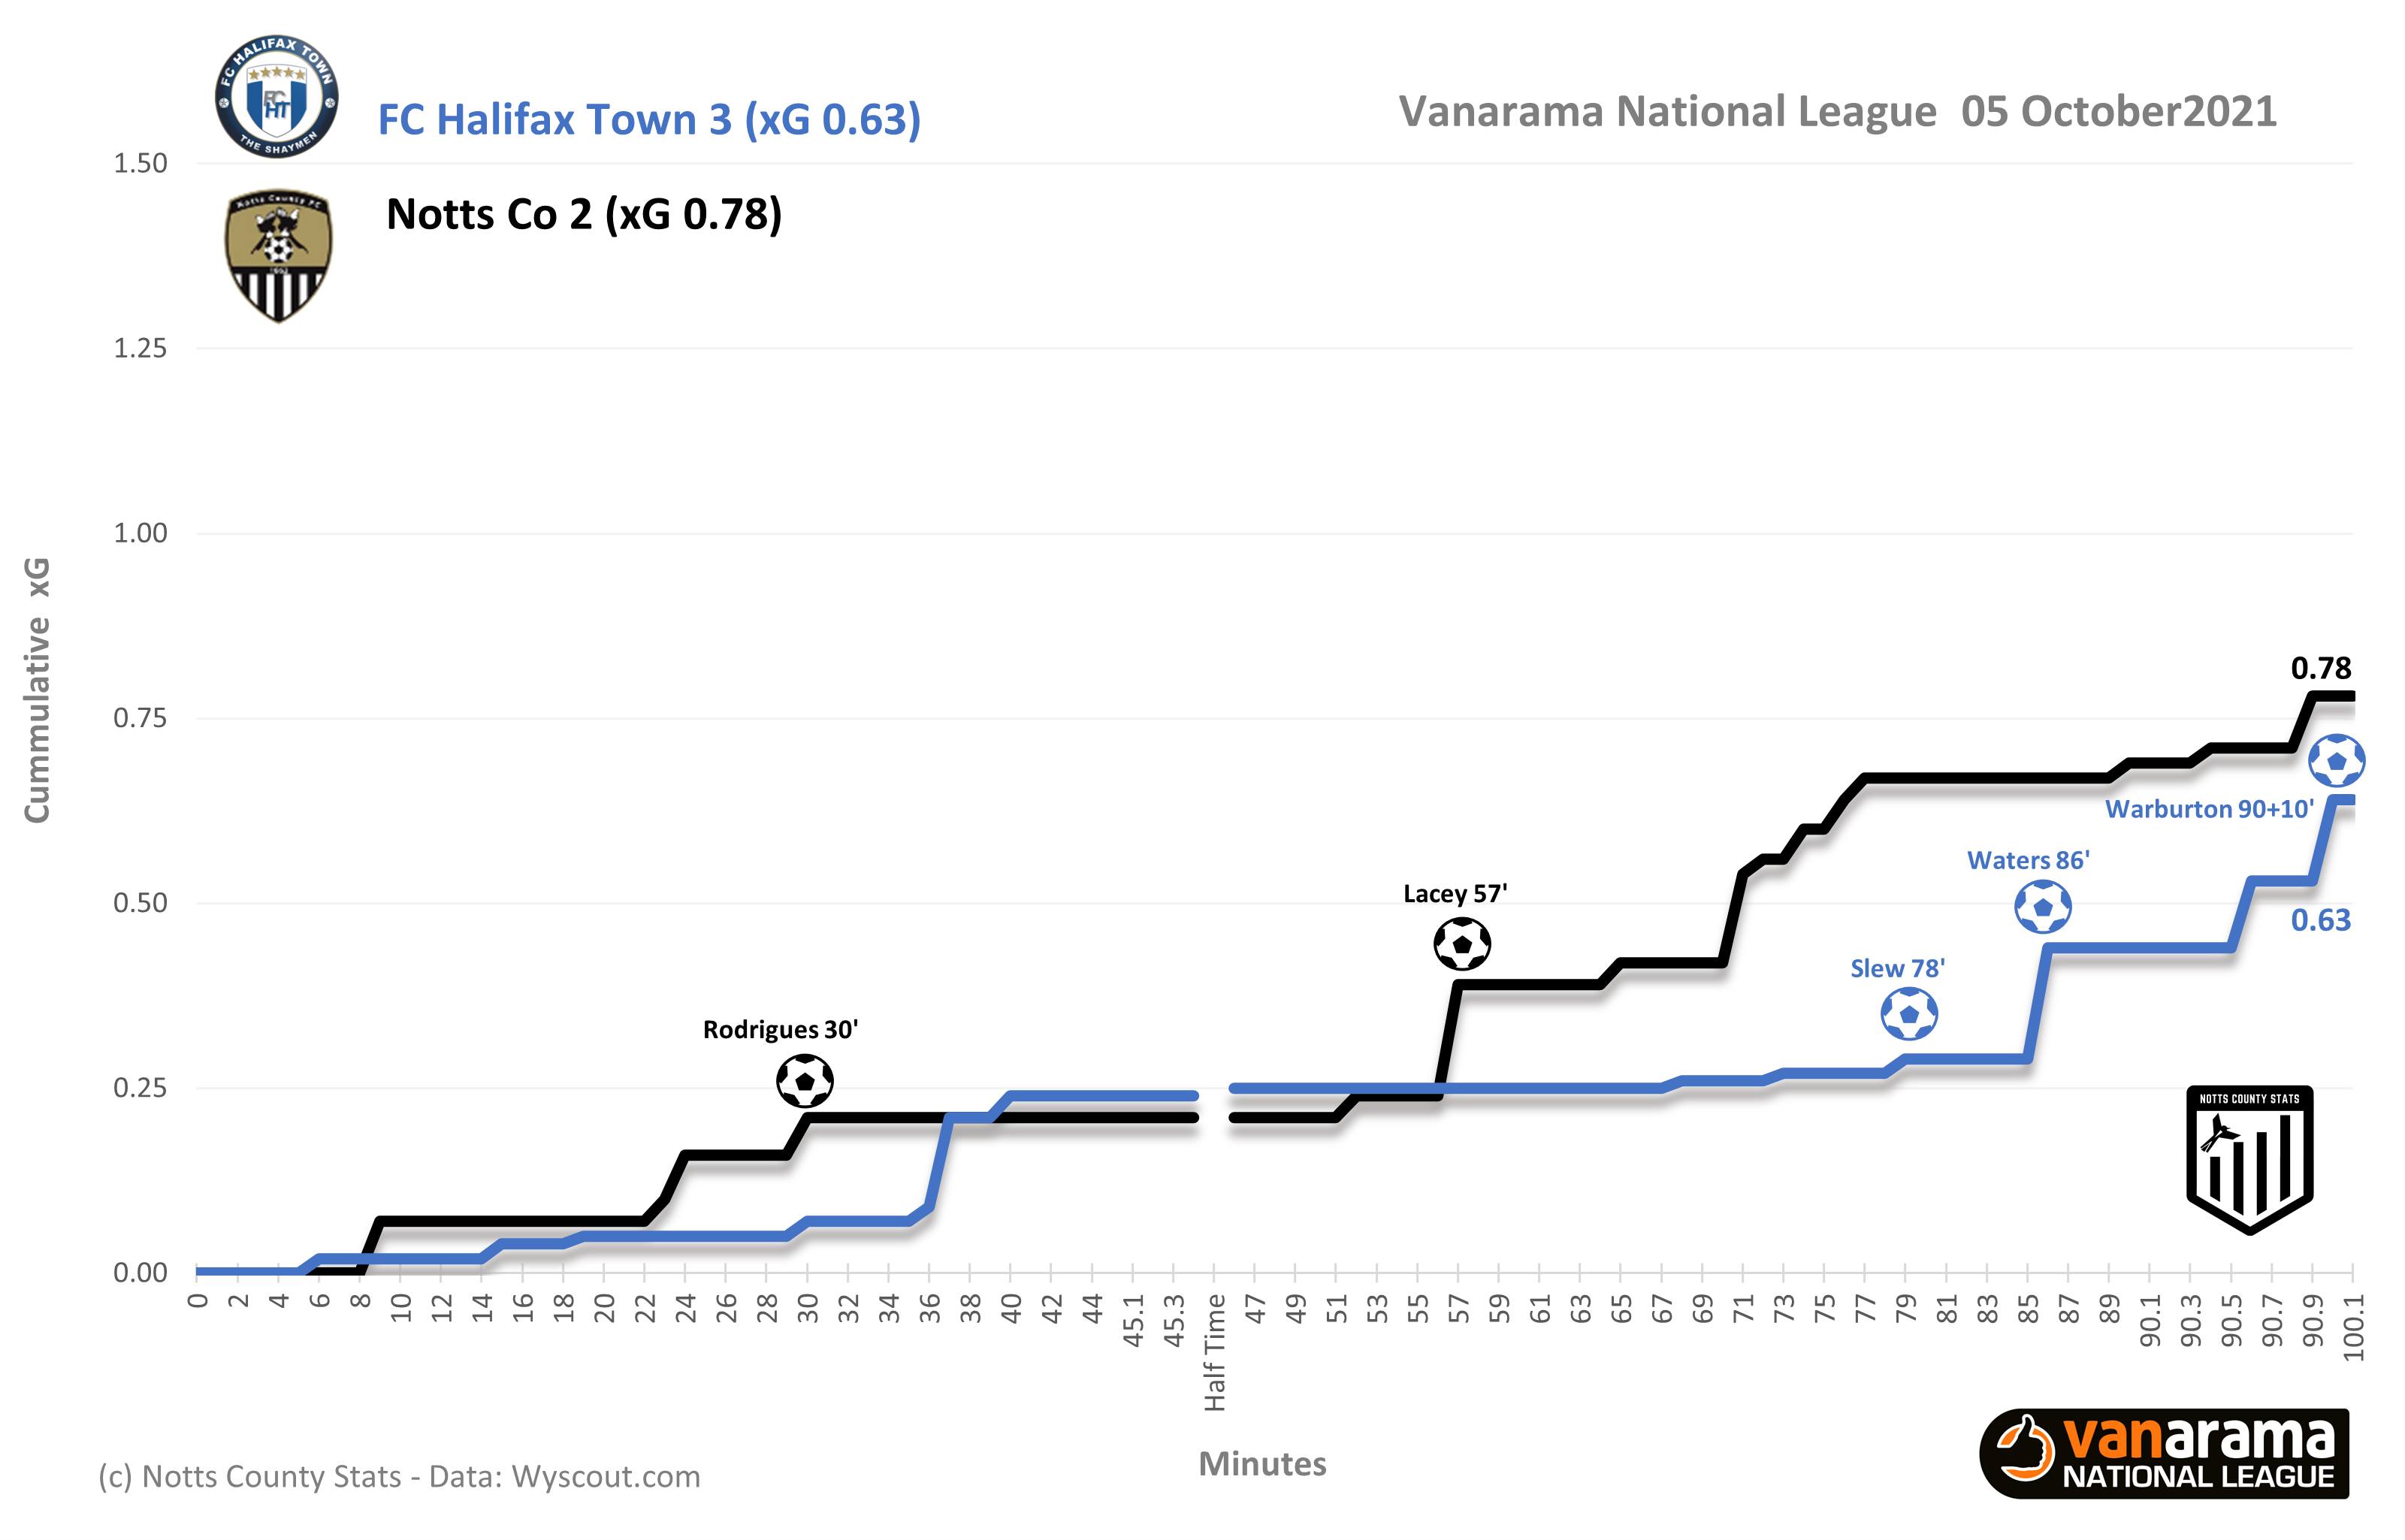
Looking at the match xG above a draw might have been fair. However if you take into account the fact Halifax were down to ten men and losing 2-0 the final result really is quite remarkable.
Having listened to Magpie Circle from Wednesday night I feel I might need to just try and a touch of clarity where I can to the science behind expected goals again.
What xG isn't is a tool to make a subjective decision over whether a player should have scored a goal or not.
What xG is is a tool to identify the likelihood of a goal being scored given a whole range of contributing factors. These factors include things such as where the attempt on goal was made, the weather conditions, whether it was a header or a shot, if it was a shot was it on the players favoured foot, was it a stationary ball or was it moving etc.
Once all of these factors have been considered you can then apply a value to the attempt which equates to a percentage of 1 goal. If we look at the player xG in the table below we can see that Rodrigues goal has an xG value of 0.05 so in it's crudest form you could say that if he made that attempt 100 times there is a likelihood he will score 5 times.
But it is so much more than that. There are formulas that you can use to run a particular scenario through thousands of times to make sure the final value given is as accurate as possible. Additionally the big stats companies like Opta also now have a huge amount of historical data to throw into the mix further improving the accuracy of the xG value applied.
The reason xG is widely regarded as an indicative metric in football is because it can help to identify trends and help to predict likely outcomes in the future.
Let's take a look at Halifax's Billy Waters. He has scored 8 goals so far this season but according to Wyscout his xG is just 4.85. This would suggest he has either been exceptionally clinical with his finishing or extremely lucky. Which ever way you look at it you have to wonder if that kind of over performance is sustainable.
The same can be applied to teams and this is where you have your so called 'Justice Leagues' where xG is converted into expected points. If we take Halifax as an example again they currently have 20 points from 10 games so 2.00 PPG. However their expected points total is 12.20 so 1.22 PPG. Again this would indicate that as a team they are over performing and have accrued more points than expected based on all of the xG data collected over those 10 games. This information will provide analysts with some key indicators when assessing a player or team's progress and assist in predicting form (if you are a betting person) or trends in play that might provide you with an edge over the opposition.
This is just a quick overview of xG, there is very much more involved but hopefully this has gone some way towards clearing up some of the confusion surrounding xG and xPTS but if anyone would like to learn a bit more please feel free to get in touch and I'll help where I can.
Anyway, Notts' player xG for the Halifax game below. Plenty of low value chances with Alex Lacey's goal the biggest chance at 0.15 xG.
Match xG and xPTS.
National League top scorers updated and another two goal game for Tahvon Campbell means he jumps up to second in the table with 8 non-penalty goals.
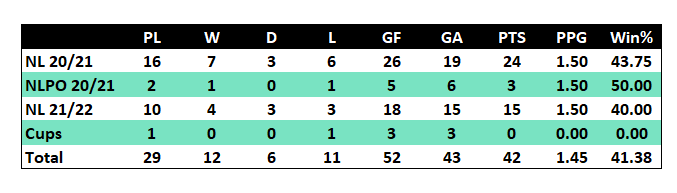
Ian Burchnall's record updated after 29 matches.
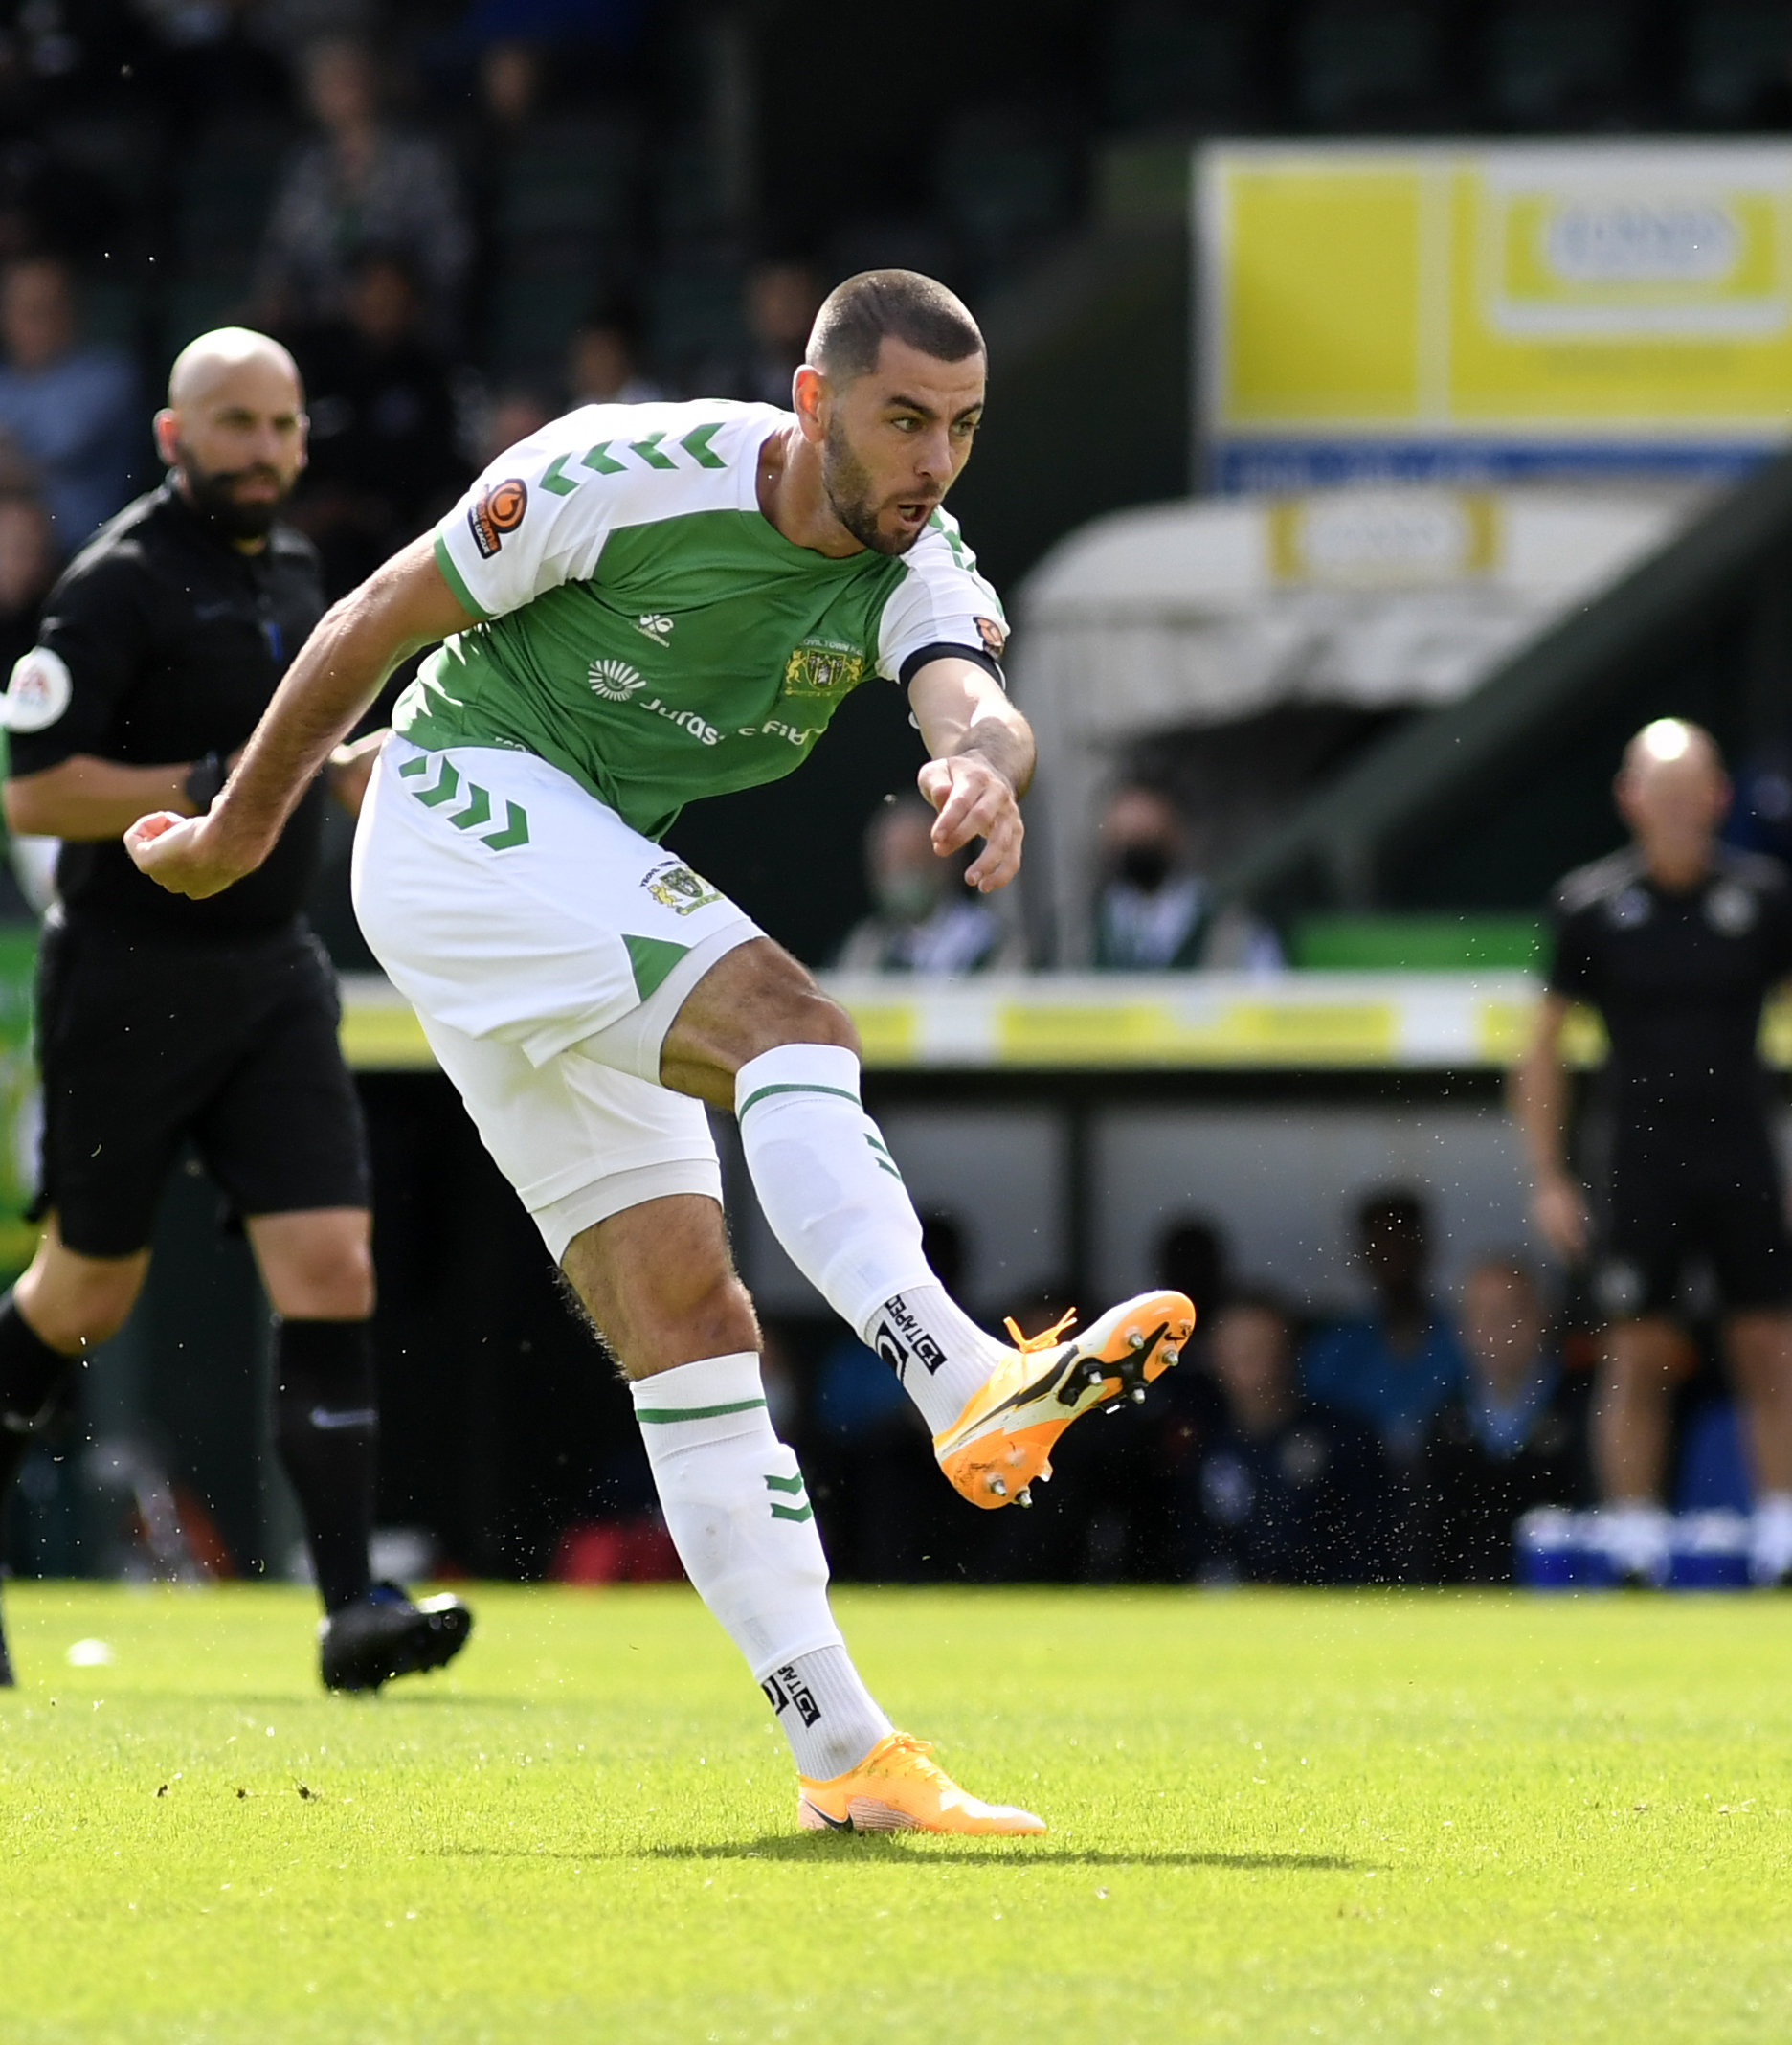
Looking ahead now and another difficult game this time away at Yeovil Town.
The Glovers have played just 7 games so far this season and are without a win in their last 3 with a convincing 3-0 away win at Stockport their last most recent victory.
How the teams compare so far.
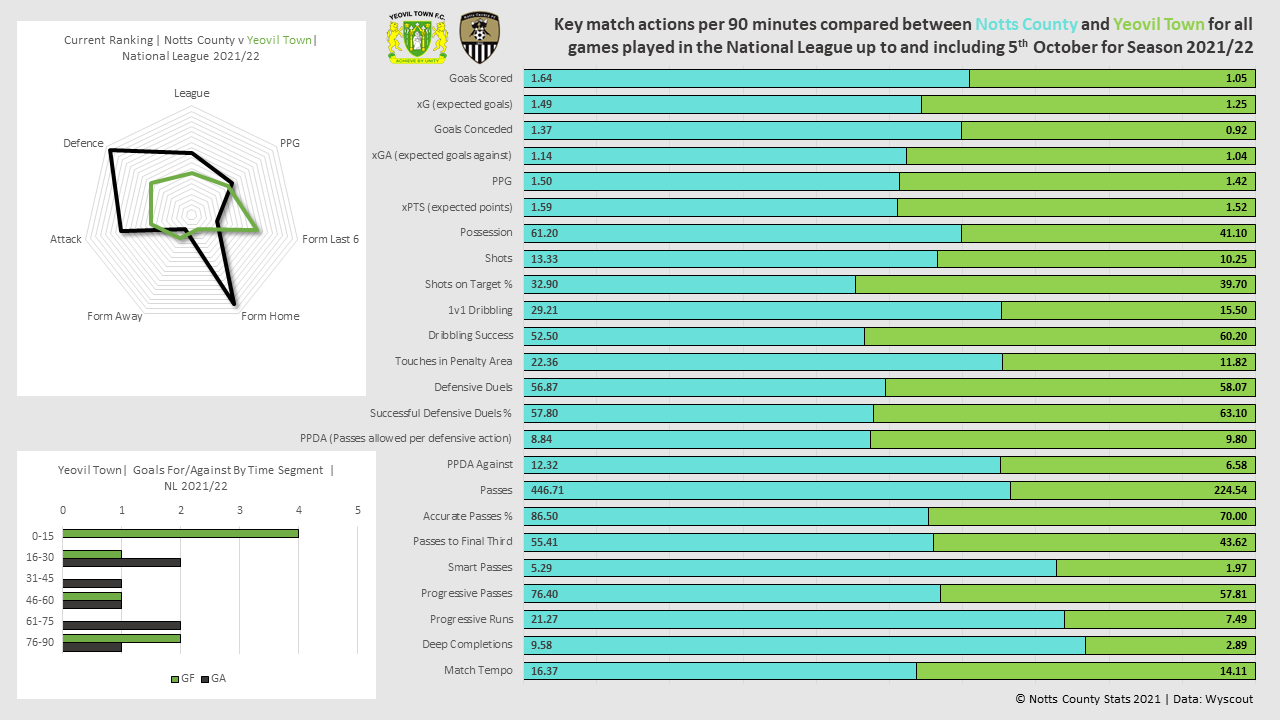
My confidence was buoyed a little when I realised Yeovil's home form was a little bit indifferent, but then I realised Notts' away form hasn't been much to shout home about having not won on the road since the opener at Barnet.
The Glovers obvious threat will appear in the form of Joe Quigley who has netted 5 times in 7 games. However it's worth noting 3 of those were penalties.
Notts fans will also be familiar with Mitch Rose and Jordan Barnett. Rose has started the last two games in his usual CM/RM position and Barnett has played all 7 games for Yeovil this season where he has mostly been playing LB.
Expect Yeovil to line up in a traditional 4-4-2 formation which might work in Notts favour if Cameron is fit and they revert to a back 3 and wing backs. All of their defeats so far this season have come against teams playing a formation that had a back 3 and they have performed better against teams with a flat back 4.
Bookies are currently offering 11/10 on a Notts win and 23/10 on a win for the hosts. You're looking at circa 5/2 for the draw.
Based on these odds Notts have a 48% chance of a win and Yeovil 30%.
Notts have not got the best record at Huish Park with a league record of P11 W1 D4 L6 but the Magpies did secure a 2-1 win in the FA Trophy in February last year.
Hopefully with a fit Kyle Cameron coming back in he will add some much needed backbone to the Notts rear guard as well as some leadership on the pitch.
If Cameron is back then I'd also like to see Ed Francis return to the starting 11 as I do think both Francis and Cameron link up well together and will hopefully provide the defence with another outlet when looking to play through the Yeovil lines.
As always thanks for reading and as mentioned earlier if anyone has any questions relating to the stats please feel free to get in touch.
Until next time.
COYP!
Richard