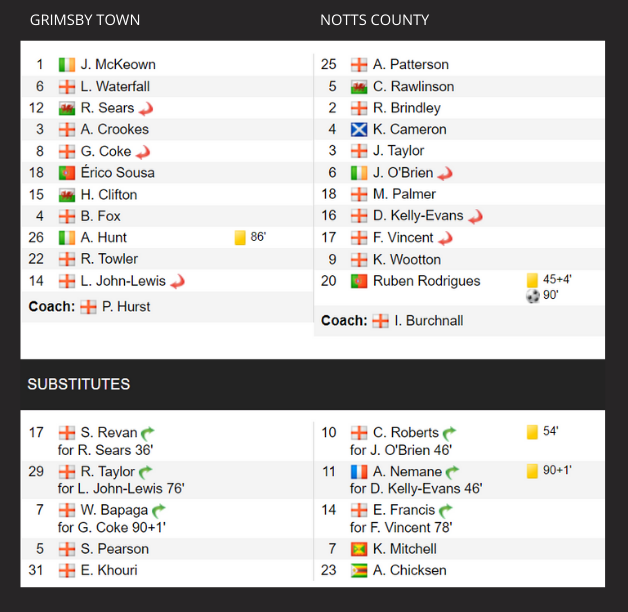
Vanarama National League | 30 October 21
Grimsby Town 0 - 1 Notts County
Blundell Park
Attendance: 7,213
So many question marks have been raised around Notts in recent times where a lack of taking chances has been costly in one way or another.
Saturday's win at (then) league leaders Grimsby Town provided an ideal example of just how important being clinical with your finishing is.
You'll see from the match stats below that some of the numbers will rank amongst the worst recorded by Notts so far this season. That said, when it comes to resilience, discipline in your defensive duties and unbounded self belief then it probably feels like it is up there alongside the best performances that have been carved out during the current campaign.
Having come a cropper to illness on Saturday evening I wasn't able to partake in some of the online banter normally to be found after a match and was interested to see on looking back some interesting comments about the result and how that is the only stat that matters.
In it's simplest form it's very hard to deny the argument but it does find it's origins in what is fast becoming a dwindling relic of a bygone era.
Now don't get me wrong, I'm no different to the next fan when it comes to the emotive side of the game and when we look back on this season it will be the hard fought 1-0 wins on the road to promotion rivals that will live longest in the memory.
But what about the stats? Well it's important to record action data and decipher it in a way that provides a club with an overall picture of their teams strengths and weaknesses.
Notts for example have always rated highly in construction stats, so things like ball possession, pass completion, progressive passes and passes into opposition box etc.
From the outside looking in an opponents analyst will be able to identify areas where they can combat these actions. We see this often with a high press being deployed which makes it difficult for Notts to play their usual game because the opportunities to progress through the lines is lessened resulting in more lateral passes and a drop in match tempo.
Take a look at the chart below and you will see that nearly all of those construction stats we talked about above are lower for Notts in this game than we are used to seeing and generally second best to Grimsby.
You might deduce from this that Grimsby had done their homework and played in a manner that limited Notts' ability to play their usual game which would have given the Mariners an advantage.
What I'd like us to focus on is the 'match tempo' and 'PPDA' columns.
Despite having less possession and allowing Grimsby more of that possession during defensive actions, Notts actually matched their opponents blow for blow when it came to match tempo.
This would indicate that despite not being able to play their normal game Notts were as aggressive as Grimsby in their build up play restricting some of the freedom of play the Mariners would normally expect to have at home.
Despite having hardly any attempts on goal Notts were able to inadvertently manage the game by adopting a change in tactics. Essentially, by developing a counter attacking philosophy Notts were able to relieve themselves of any constant pressure. We should also note that defensively Notts made a very job of keeping their hosts at arms length with the home team only hitting the target with one in fifteen attempts.
Key match stats.
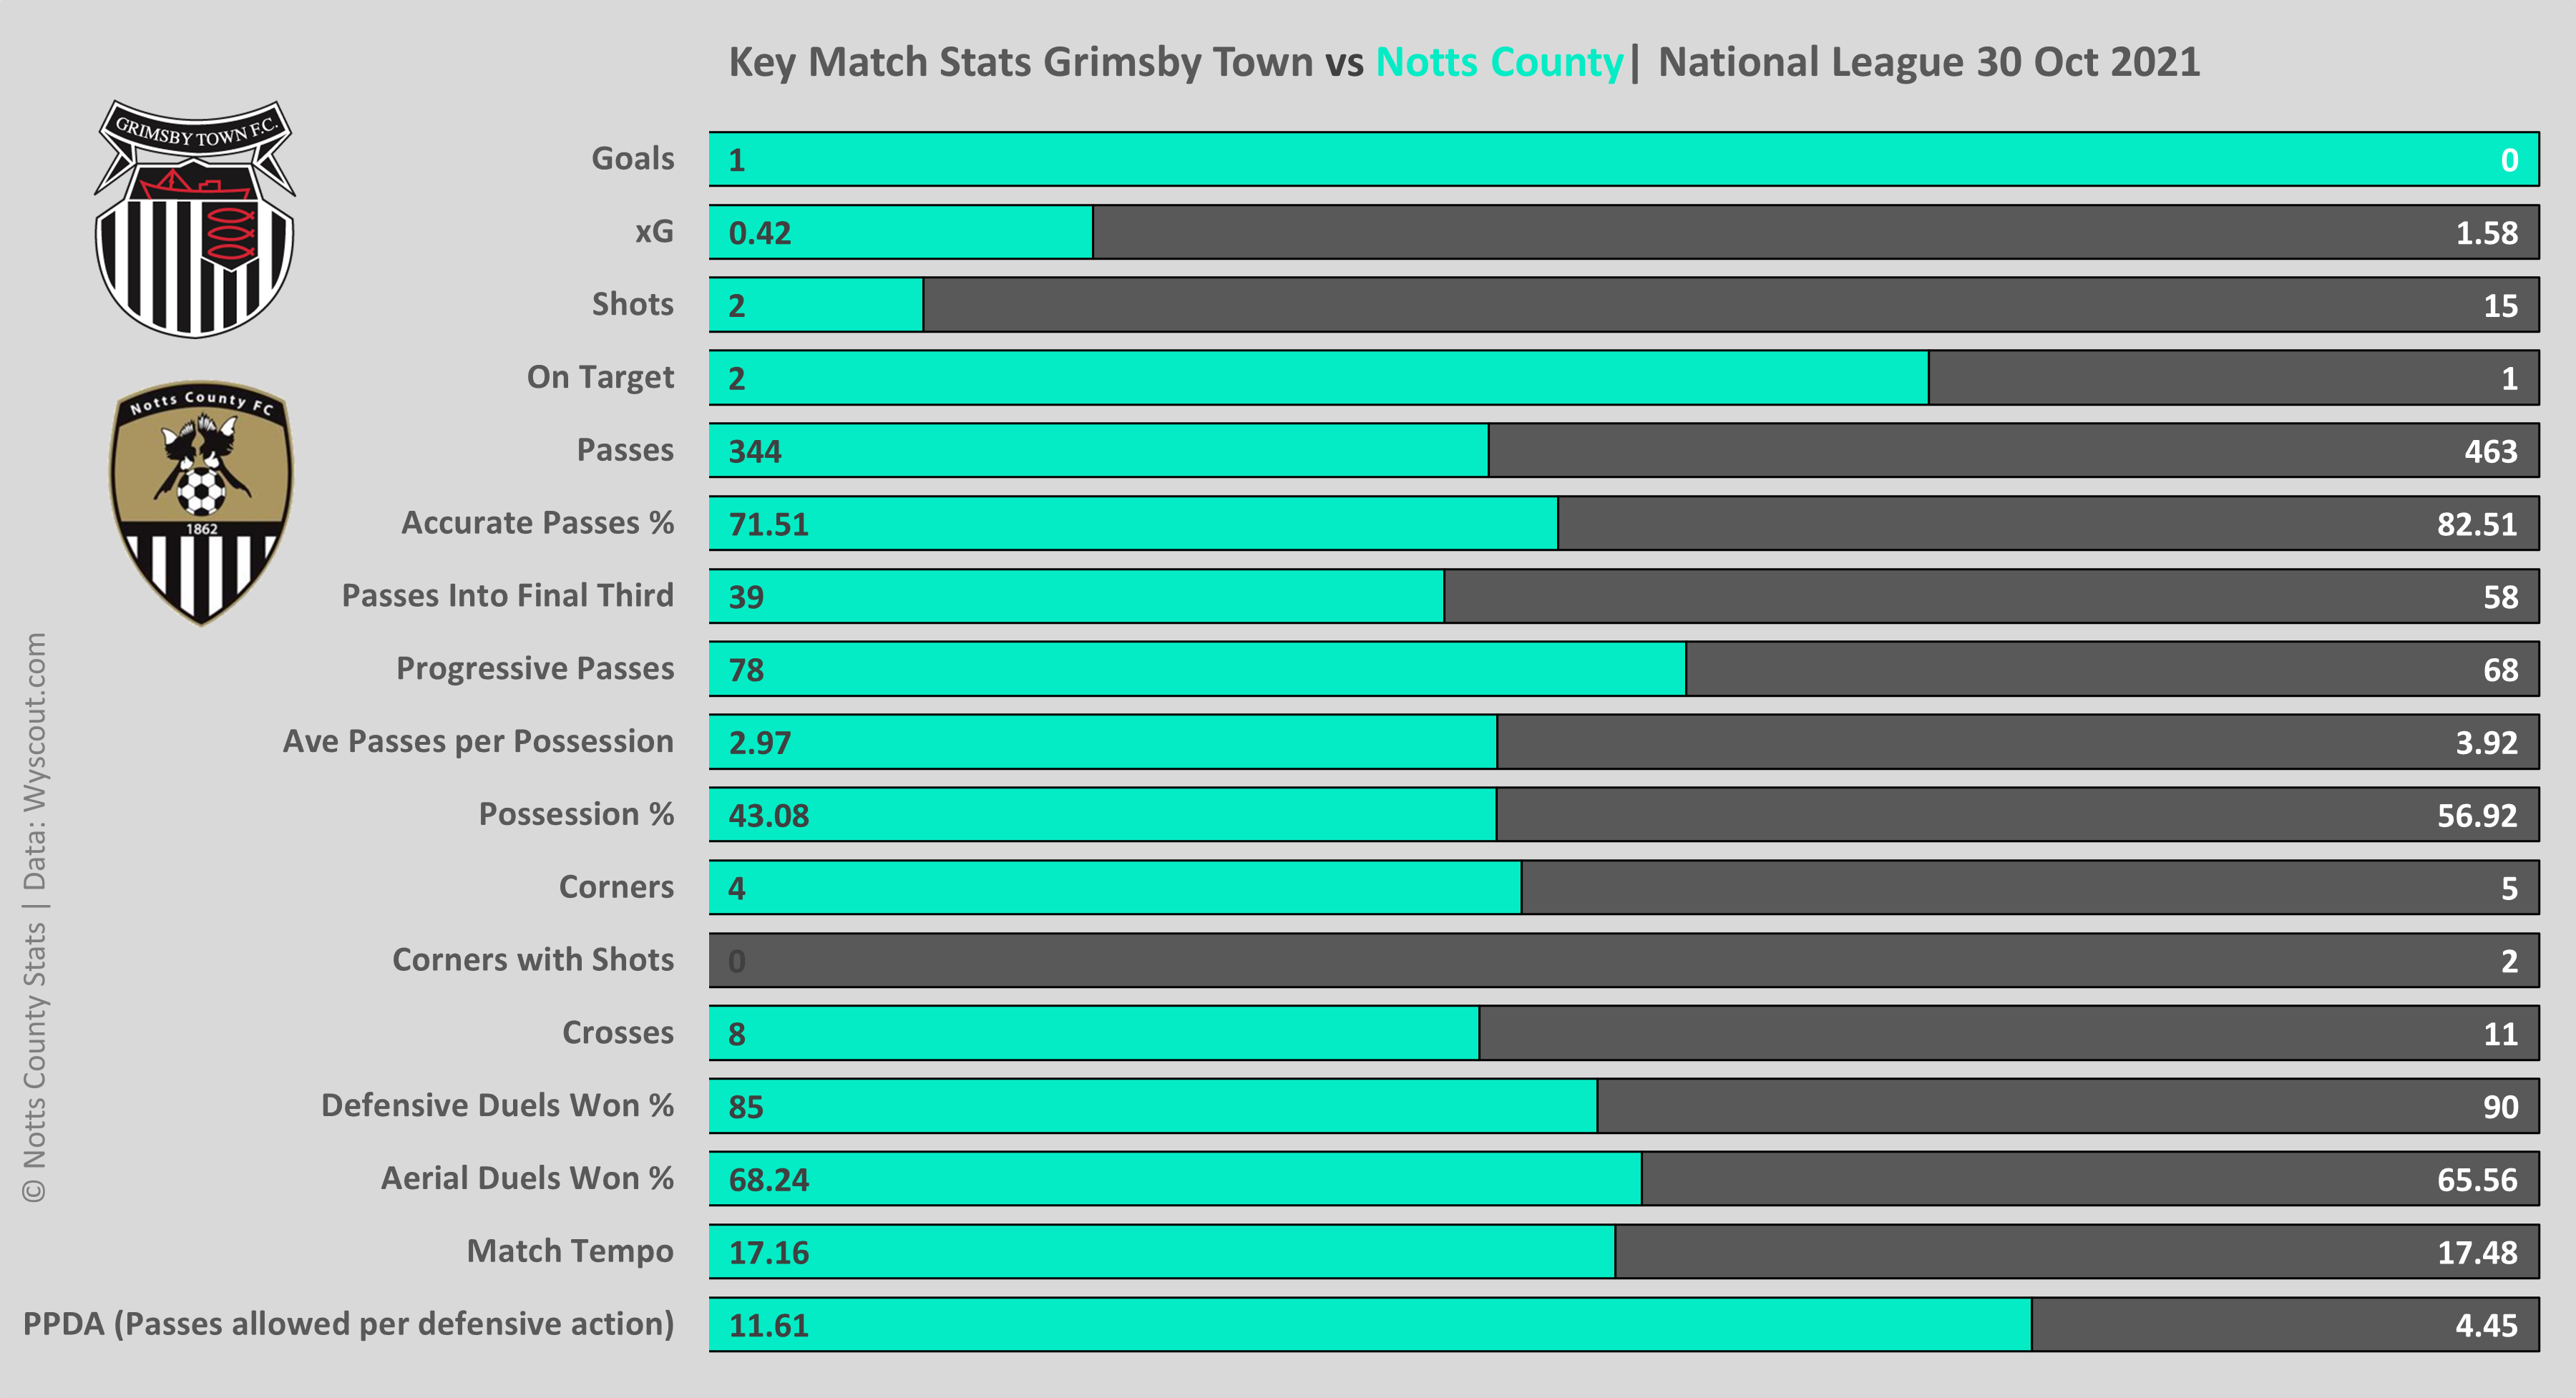
Match tempo has been a key marker of Grimsby's play this season and the average faced by Grimsby before Saturday was 13.27. This is an area we have definitely seen an increase in from Notts over the last few games and it definitely seems to be bringing it's rewards.
Finally before we move on to the rest of the stats a quick word about another analytical metric that get's a fair bit of slack from the non-converted, xG.
You may look at the shots data above and declare xG to be a complete farce. Well if you read my preview for this game you'll be aware that I suggested based on xG Grimsby were scoring considerably higher than was expected. This would suggest they have either been very clinical in front of goal or circumstances have played out to their advantage. Either way it's always assumed that those sort of numbers are not usually sustainable.
Well this game certainly did much to prove that point but more on this later in the article.
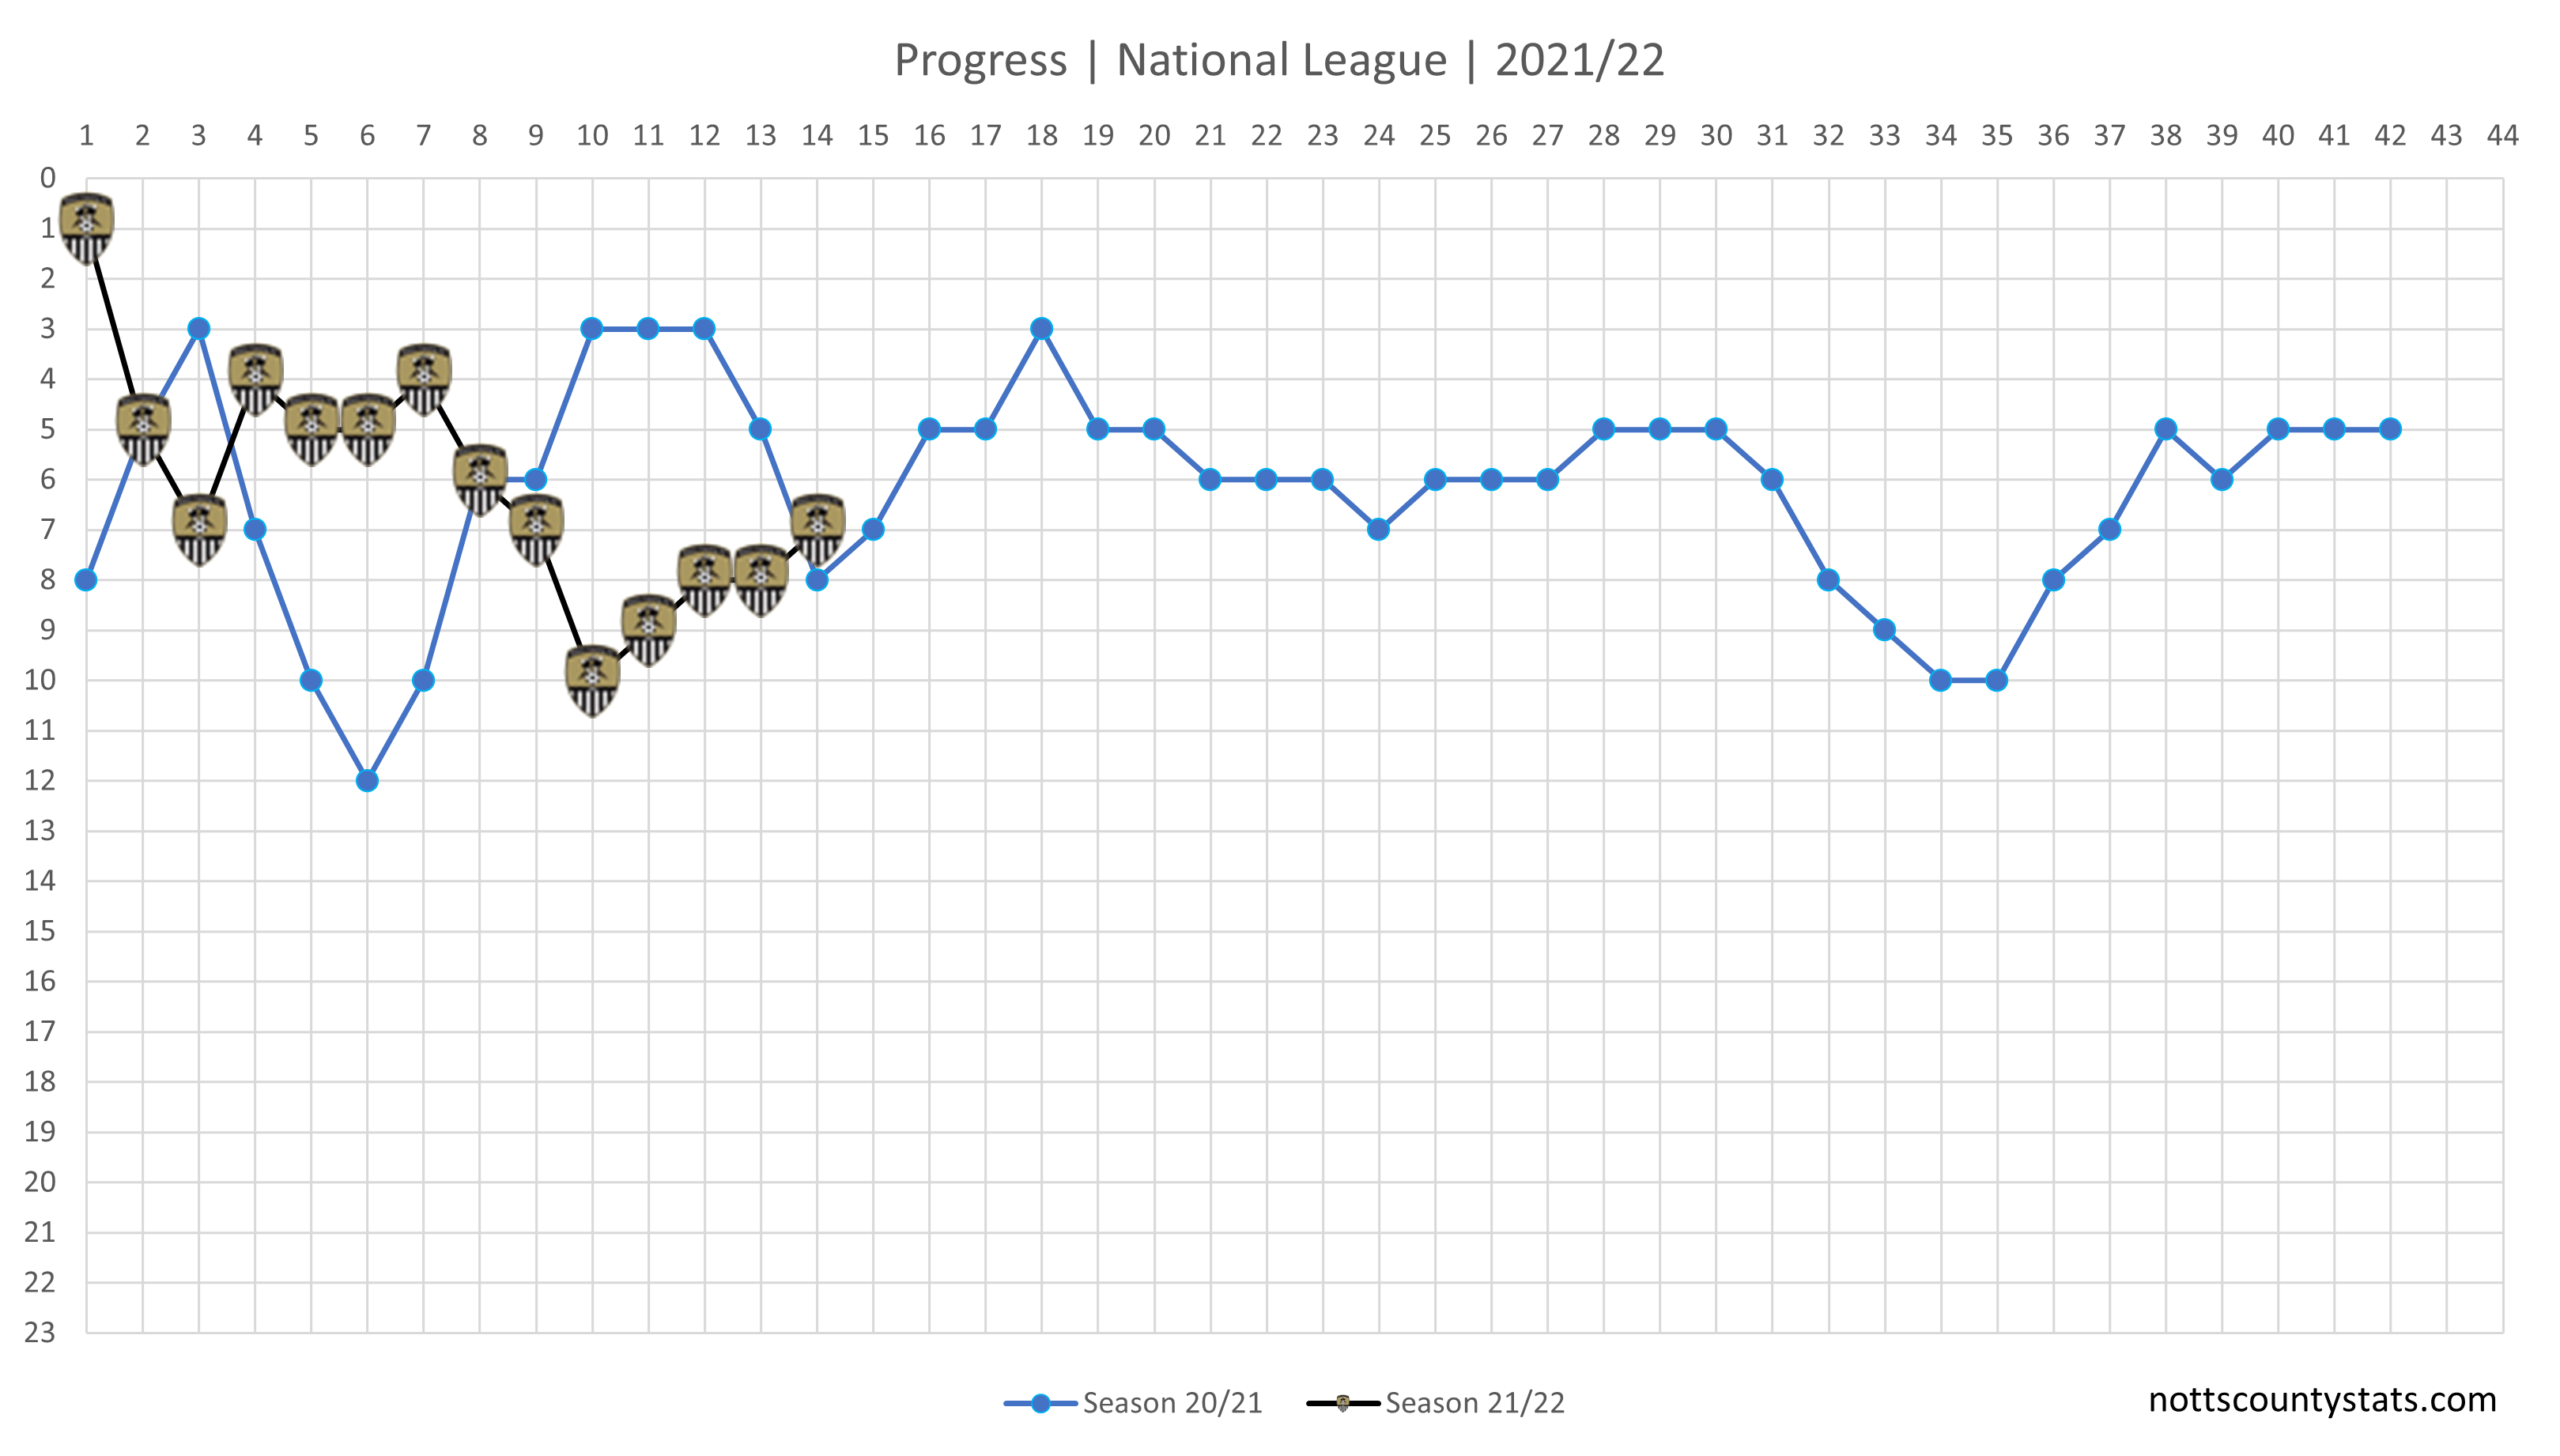
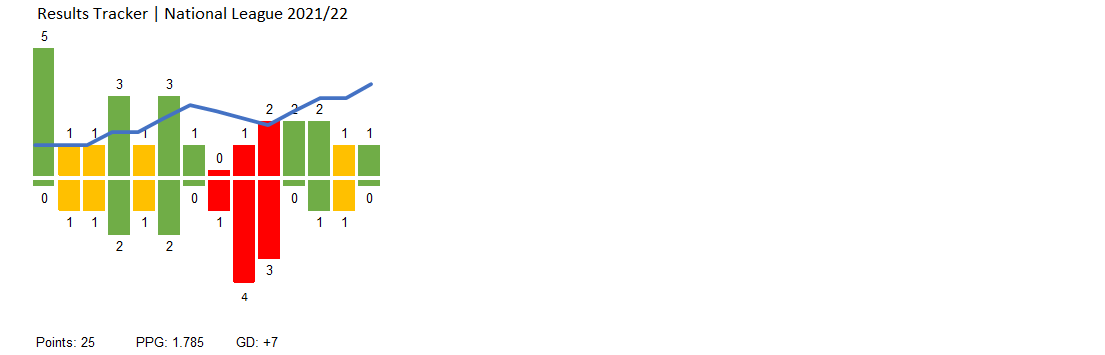
Points needed updated and 1.785 PPG on average would historically see a top 3 finish if sustained. Click on the legend tags at the top to filter options.
Progress updated. The win saw Notts move up to 6th place on Saturday but I've revised this to reflect Bromley's excellent win away at Woking last night which saw Notts drop down to 7th place.
National League results tracker updated and it's nice to see us putting some distance between now and those horrible 3 defeats. Urgh, not a fan of the colour red!
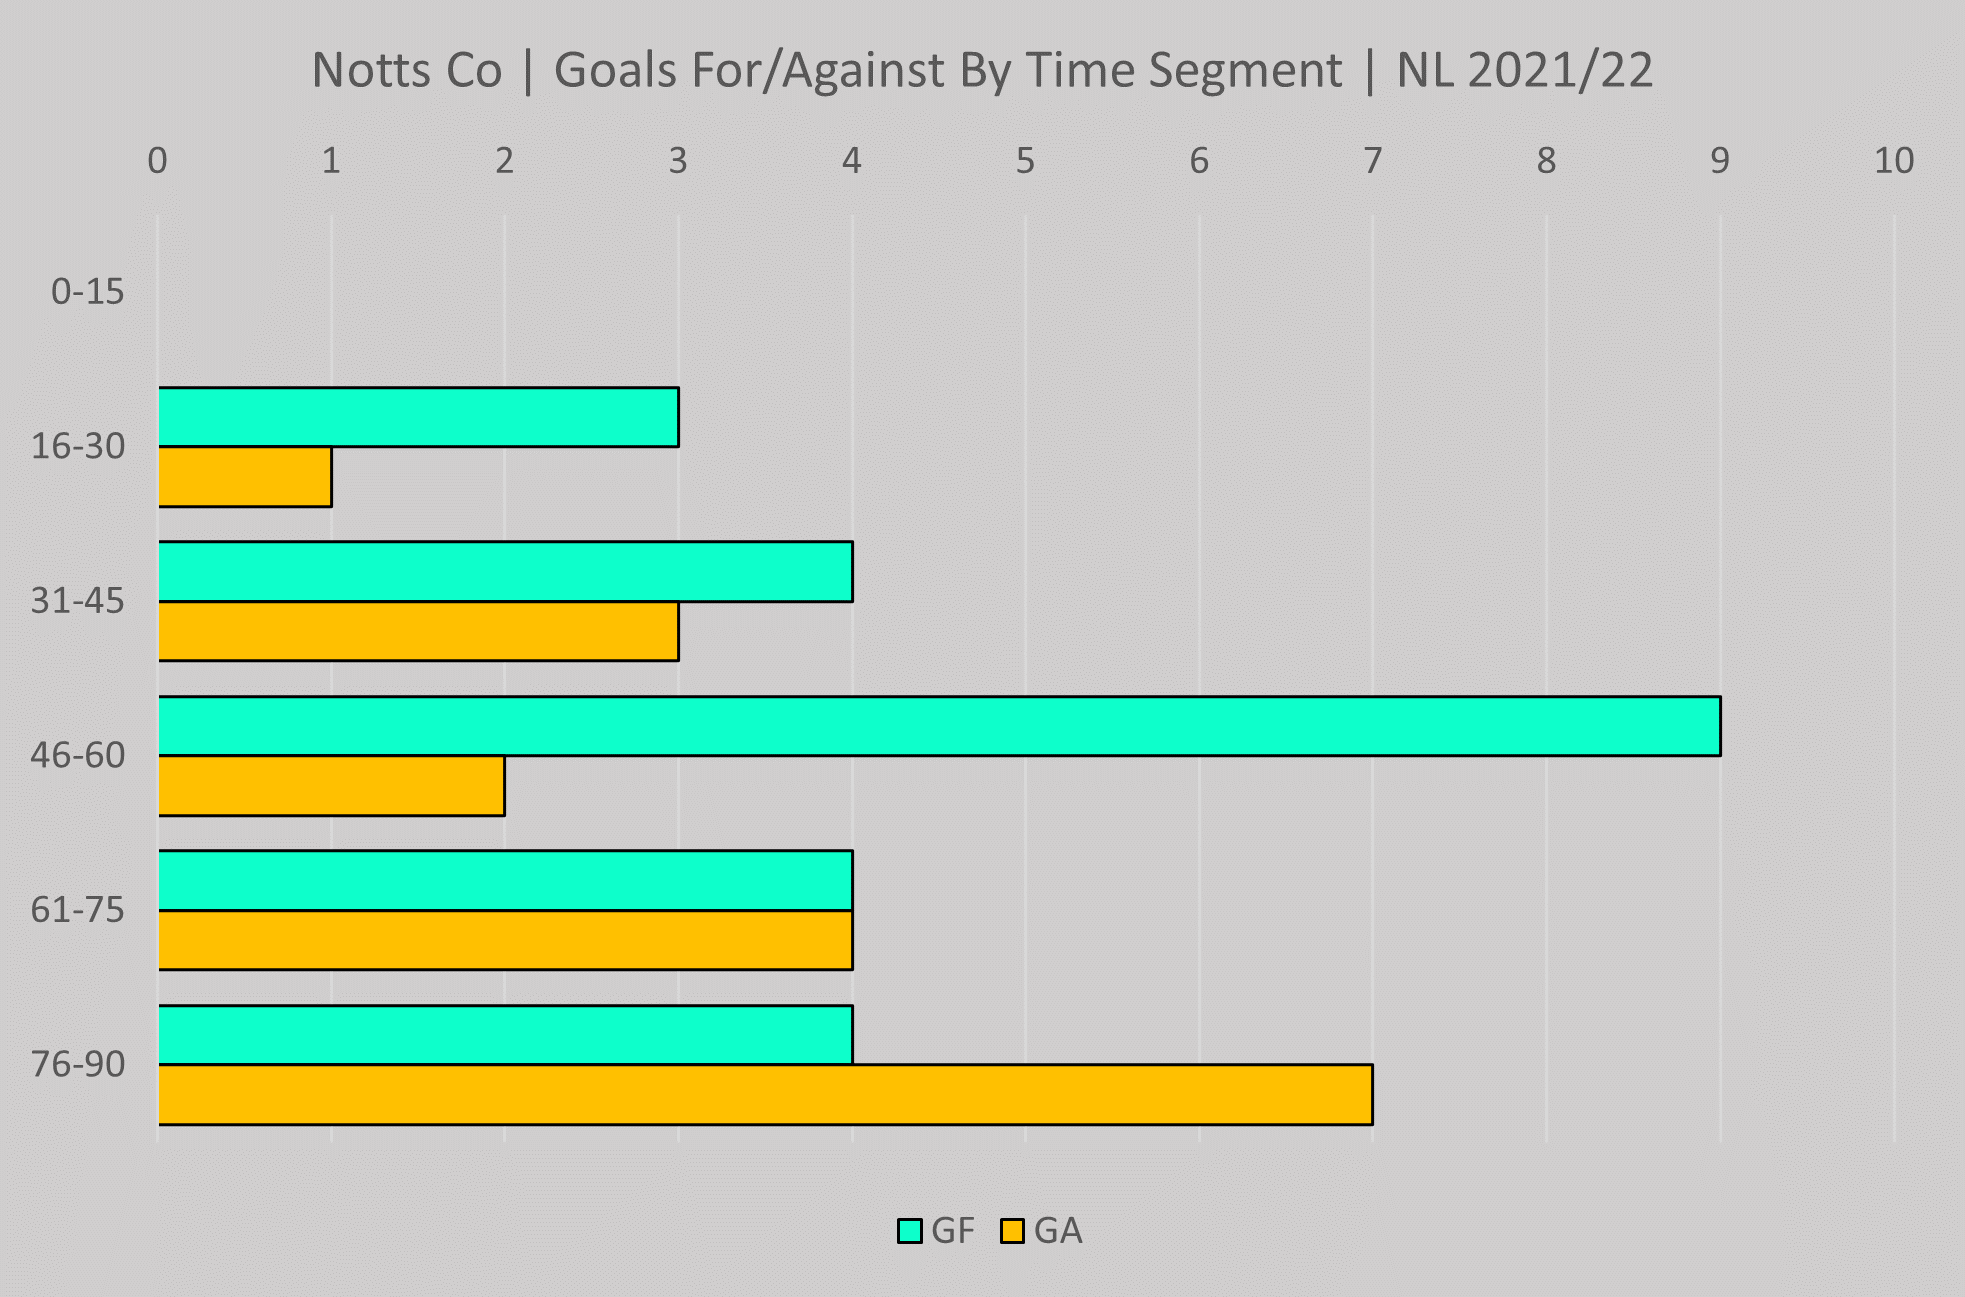
Goal segment chart updated. Nice to see Notts adding to the late goals tally for a change.
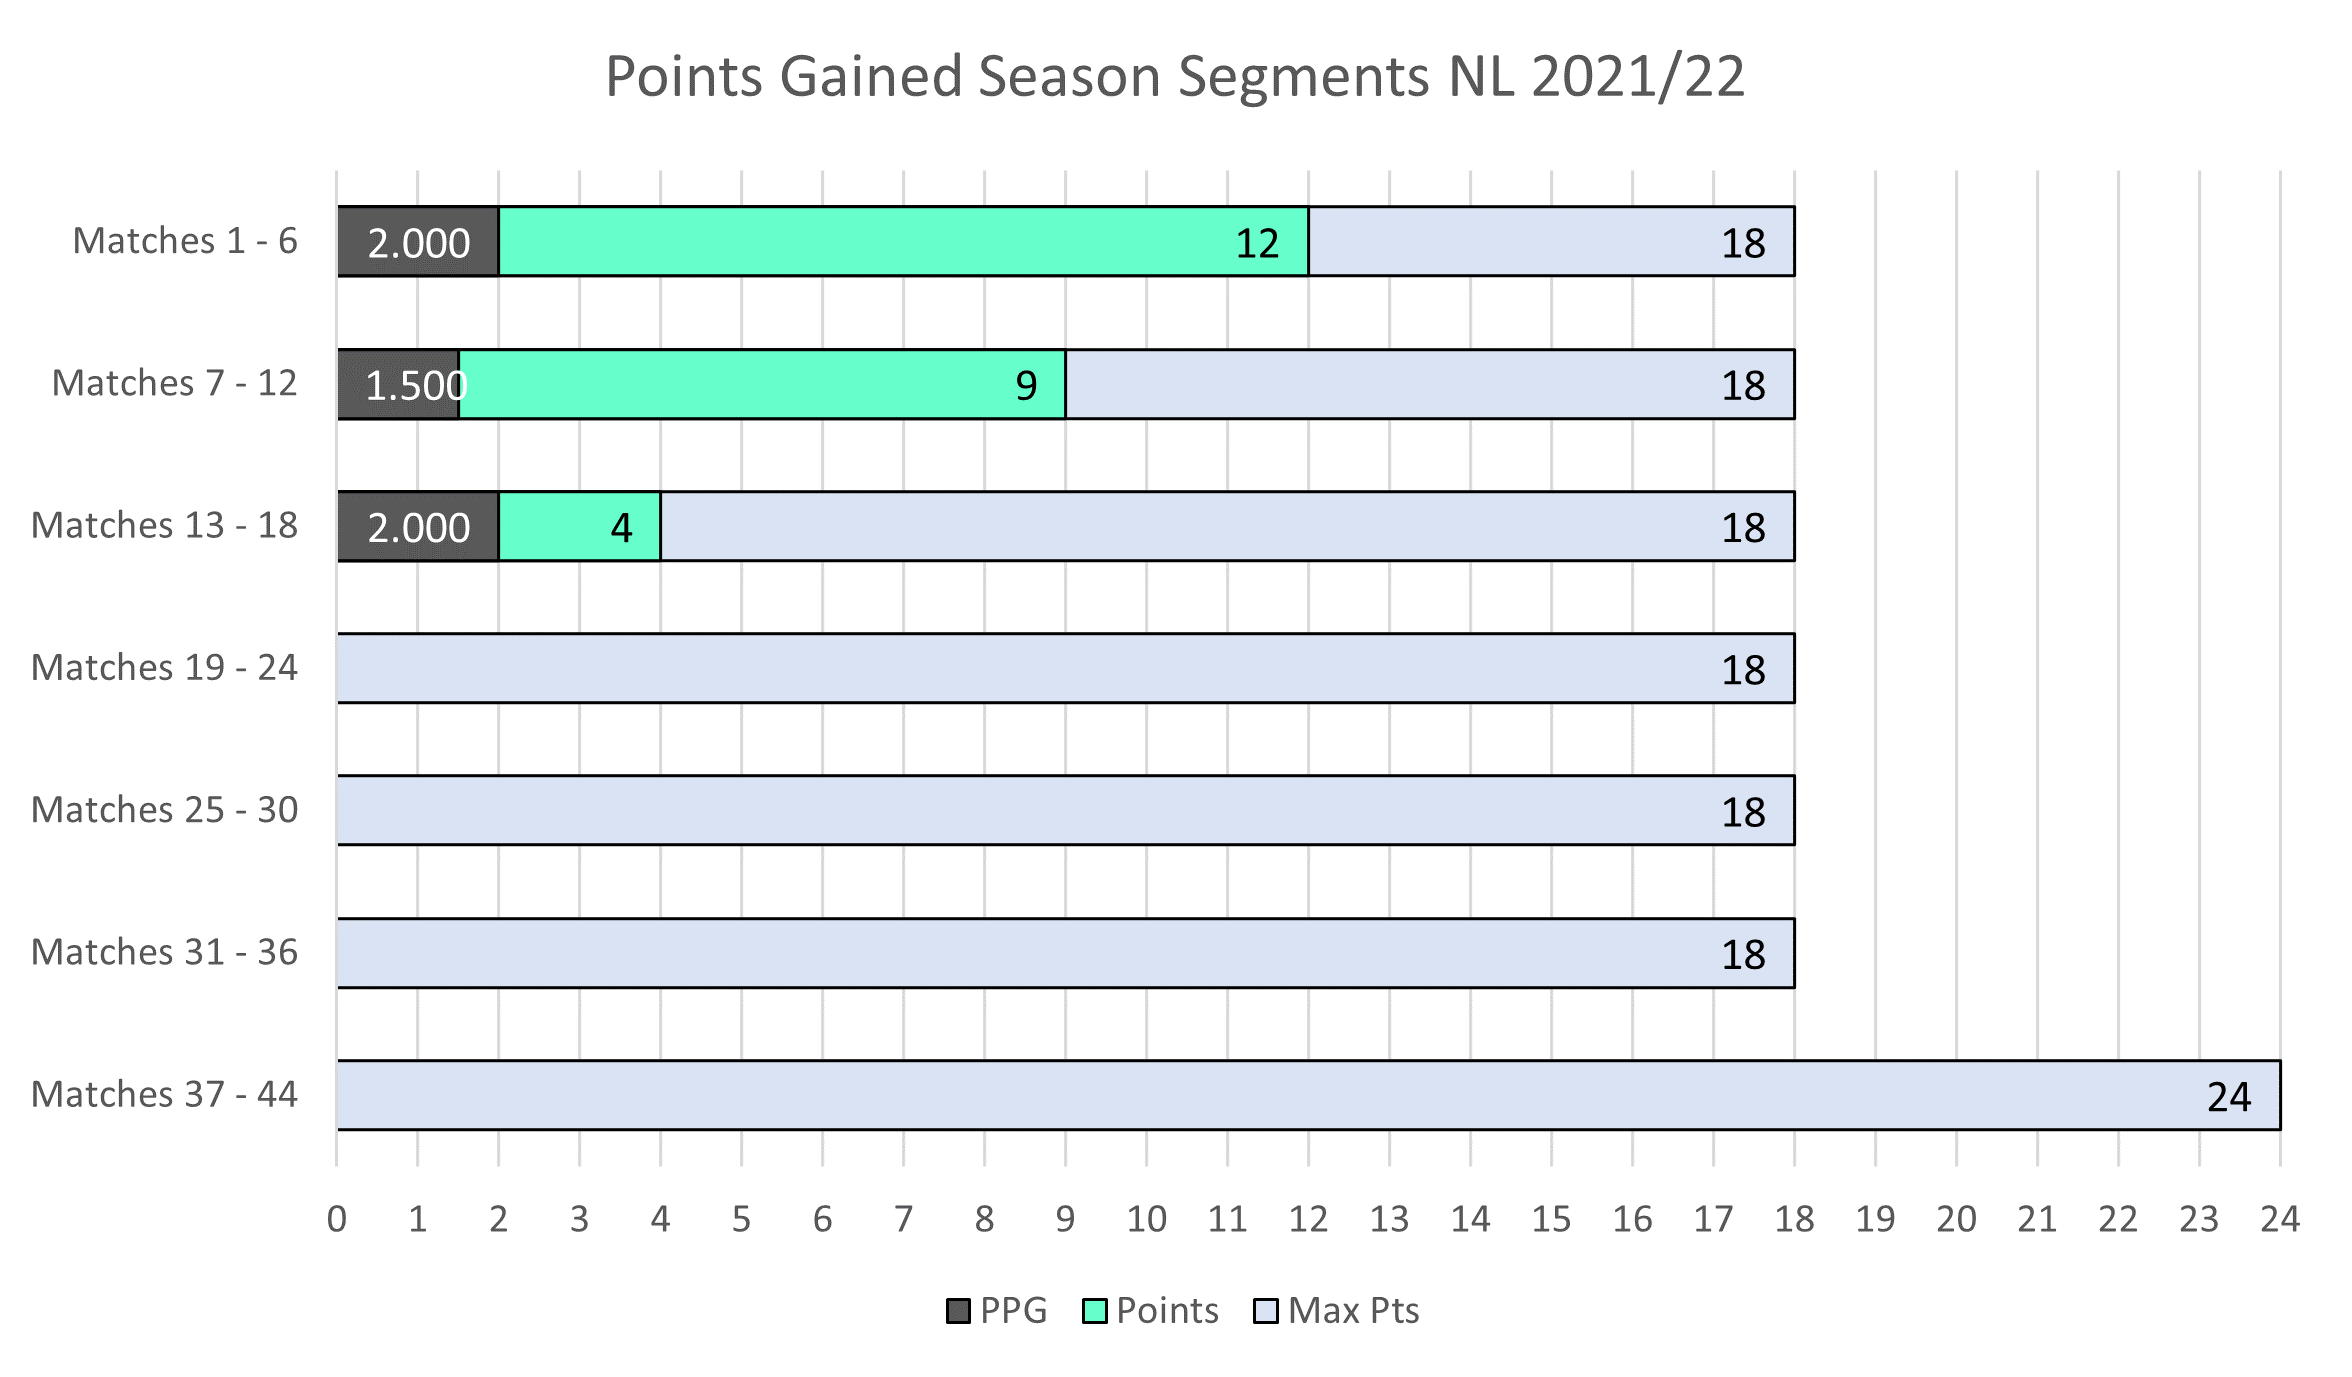
Six game segments updated. 2.00 PPG average for the first two games of this six game segment.
Player stats next and this is the new table that is also available to view on the player stats page of the website here. There will also be separate tables for the two cup competitions.
Goals and assists chart updated for all competitions. Ruben Rodrigues is now the clubs highest scorer so far and has contributed to 12 goals not including second assists.
Goal scatter chart.
Expected goals up next.
As mentioned previously this is what can happen when you don't take your chances and why identifying trends using xG and other analytical metrics are so important in the modern game.
Before Saturday Grimsby had averaged 2 goals per game with an average of slightly over 12 shots per game. So that's a goal every 6 attempts. To use that as a yardstick you would have expected them to net at least twice against Notts.
As it happens they have scored almost 7 goals more than expected so the blank 'GF' column in 15 attempts versus the Magpies is an example of how these things can start to level out when you are out performing your expected numbers.
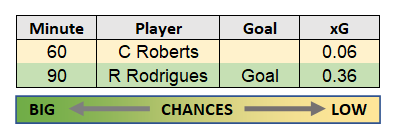
Notts' player xG below, it took me ages to compile . . . but blink and you'll miss it!
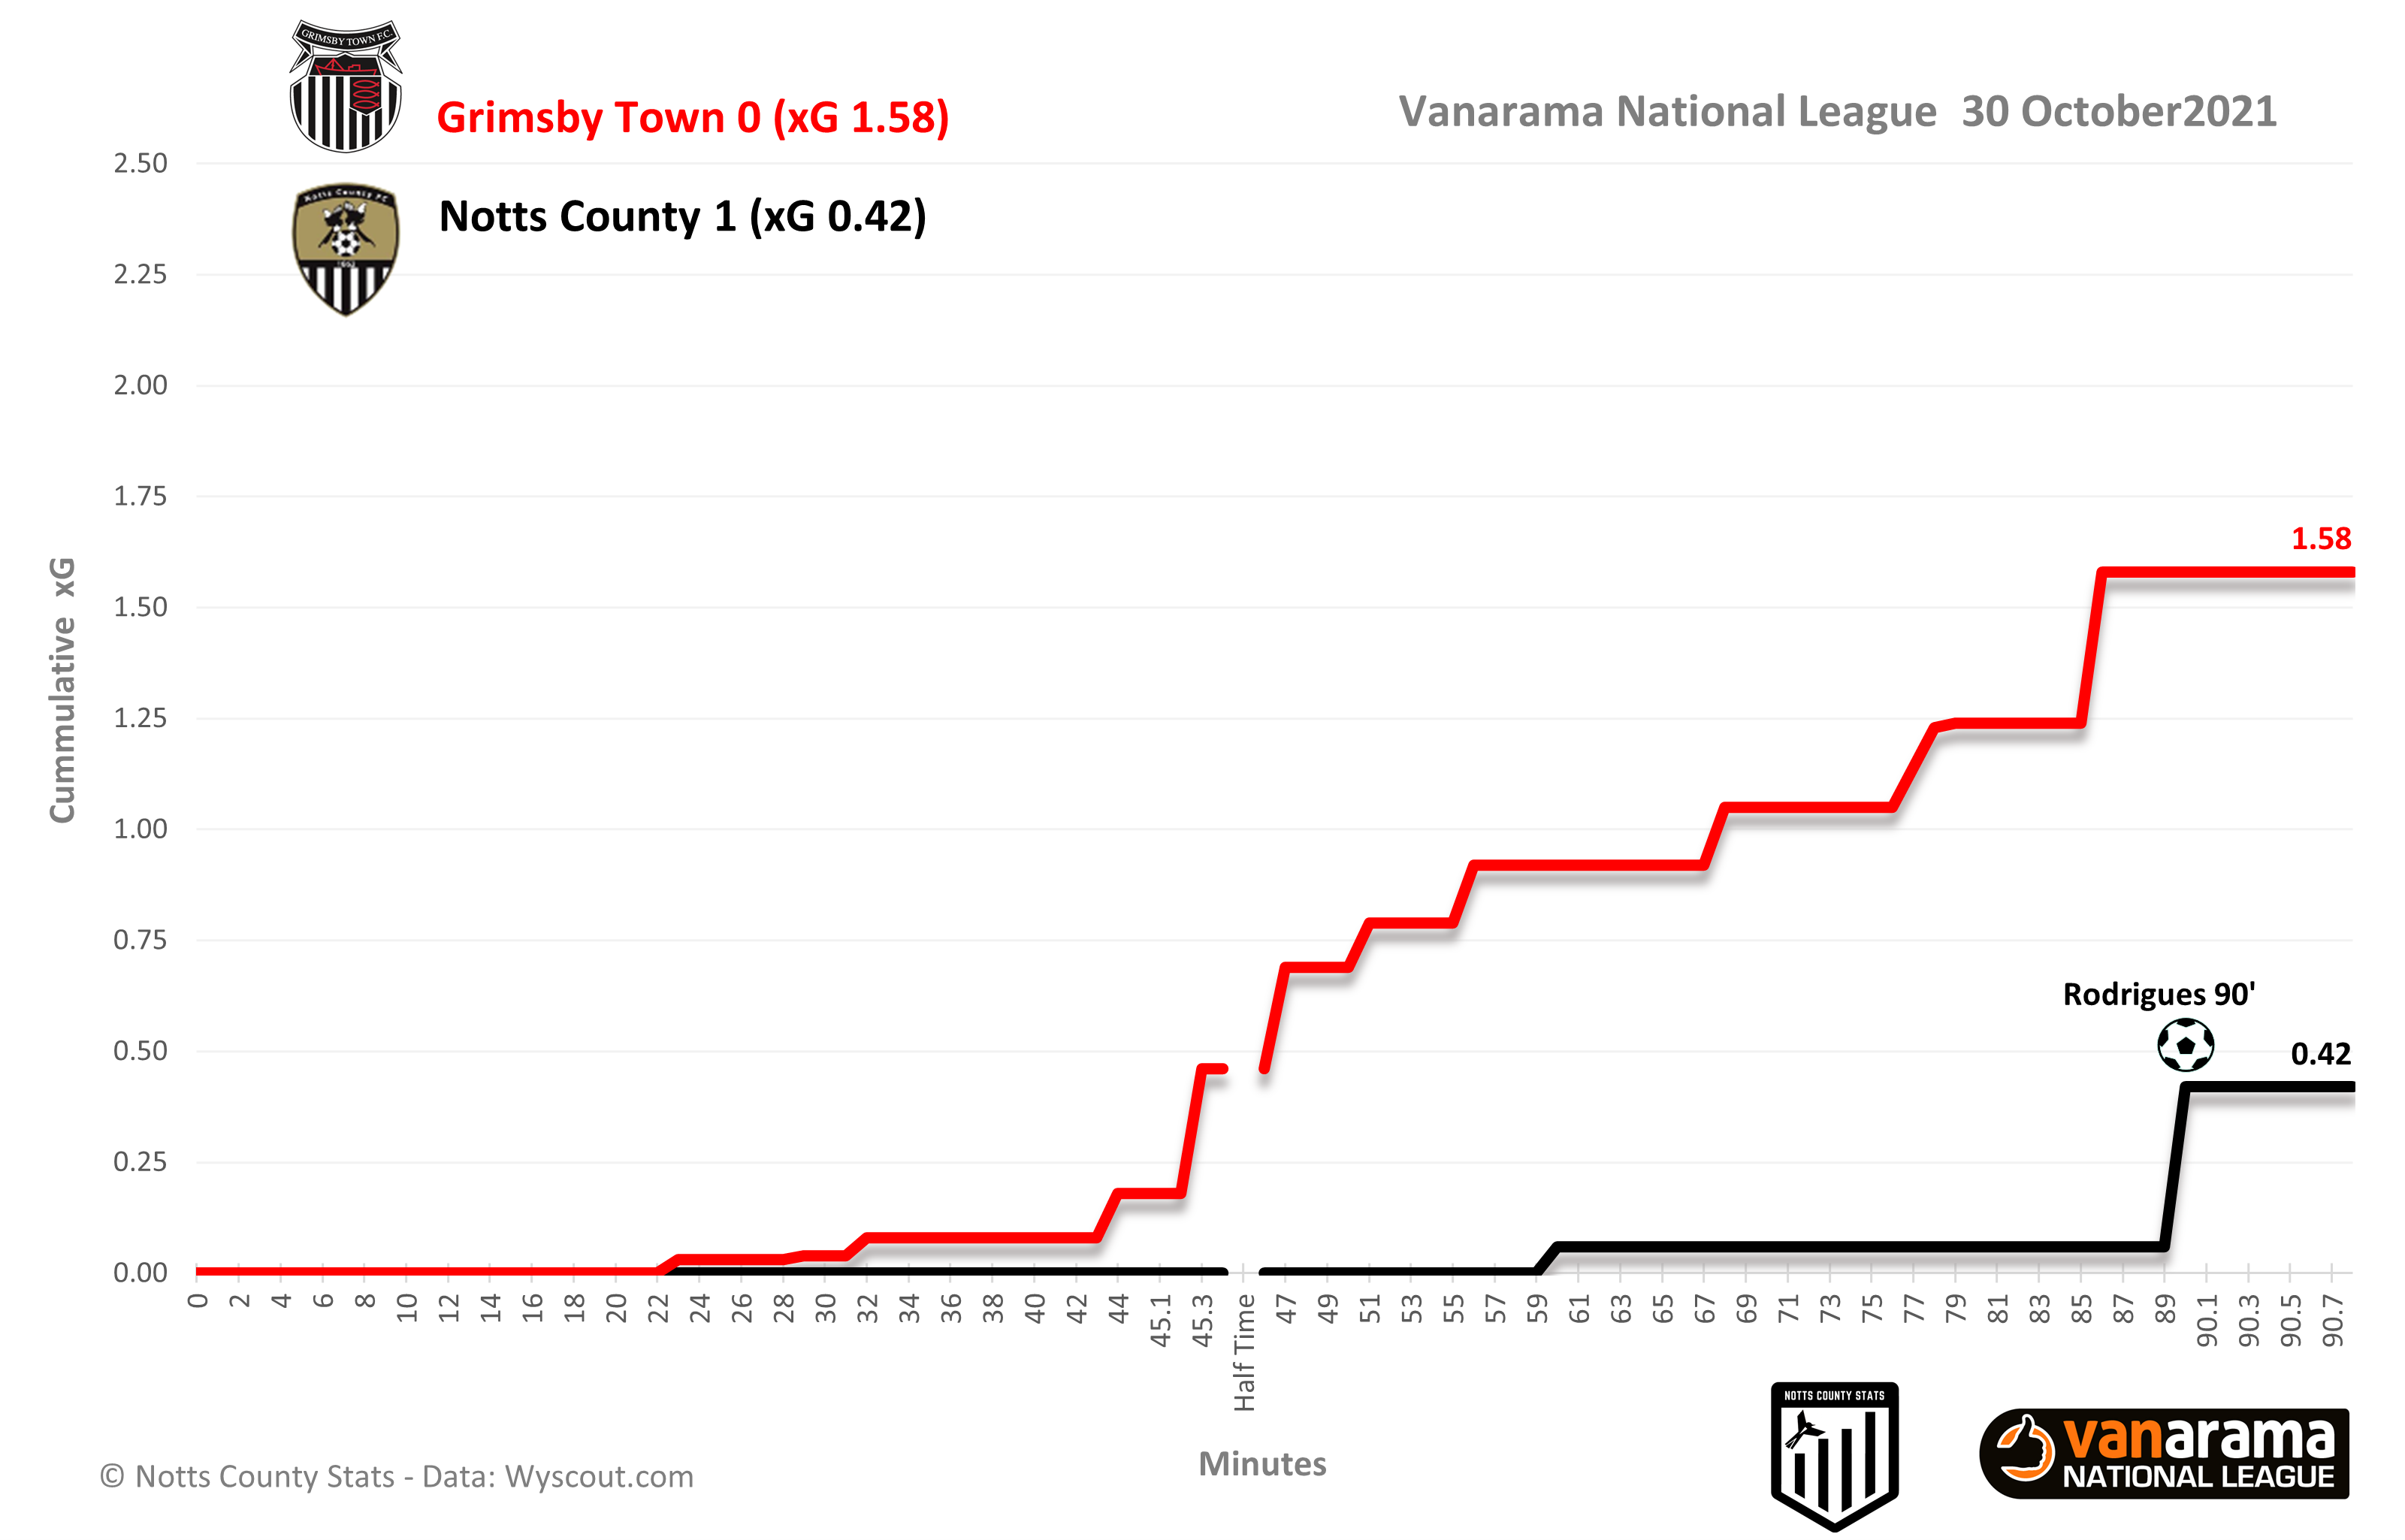
Match xG and xPTS.
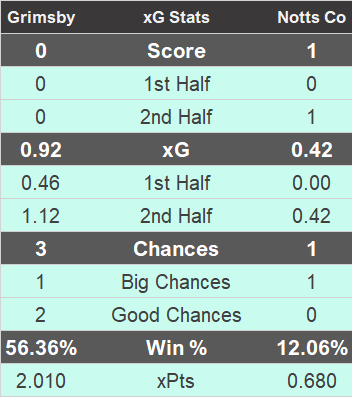
Obviously based on chances created you'd have expected Grimsby to take the points. That's where the stats come in though.
It's clear Grimsby's downfall was their inability to capitalise on the creation of some good chances. They'll need to revisit that and see how they can stop that happening again. There will be a number of factors to consider, are they missing a key striker (e.g. McAtee)? Did the chances fall to the right players? Did they threaten in the right areas? Would a different set up have helped create better chances? I know, fancy having to refer to statistics to help identify areas for improvement eh.
National League goal scorers includes cup games, penalties and own goals. Again, it's an interactive table so use the search bar to drill down on specific players or teams and click on the column headings to toggle high-low or low-high.
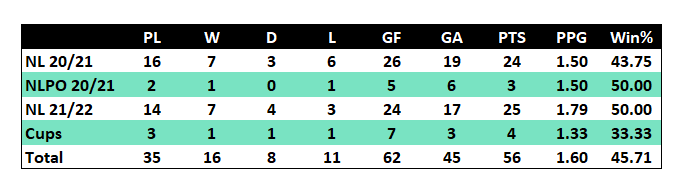
Ian Burchnall's record updated after 35 matches. Where does the time go?
Currently for all competitions Ian's PPG stands at 1.60 with a 45.71 win percentage.
So onto Rochdale on Sunday afternoon and an FA Cup First Round tie at Spotland. Preview to follow.
As always thanks for reading and for your continued support. As mentioned previously if anyone has any questions relating to the stats please feel free to get in touch.
Until next time.
COYP!
Richard
Notes:
Match Tempo - Relates to the number of team passes per minute of pure ball possession. The more passes per minute the higher the tempo.
PPDA (Passes Allowed Per Defensive Action) - A metric that can quantify the extent and aggression of high presses employed by teams. PPDA = Number of Passes made by Attacking Team (opponent) / Number of Defensive Actions.