Vanarama National League | 13 November 2021
Notts County 2 - 0 Solihull Moors
Meadow Lane
Attendance: 12,843
A complete performance in front of a record attendance lay to rest the ghost of Manager's past as Neal Ardley returned to familiar territory only to see his Solihull Moors side, unbreeched defensively in 7 of their previous 8 games, put to the sword by Ian Burchnall's well drilled Magpies.
Anyway, enough of the superlatives, lets get into the stats!
Key match stats.
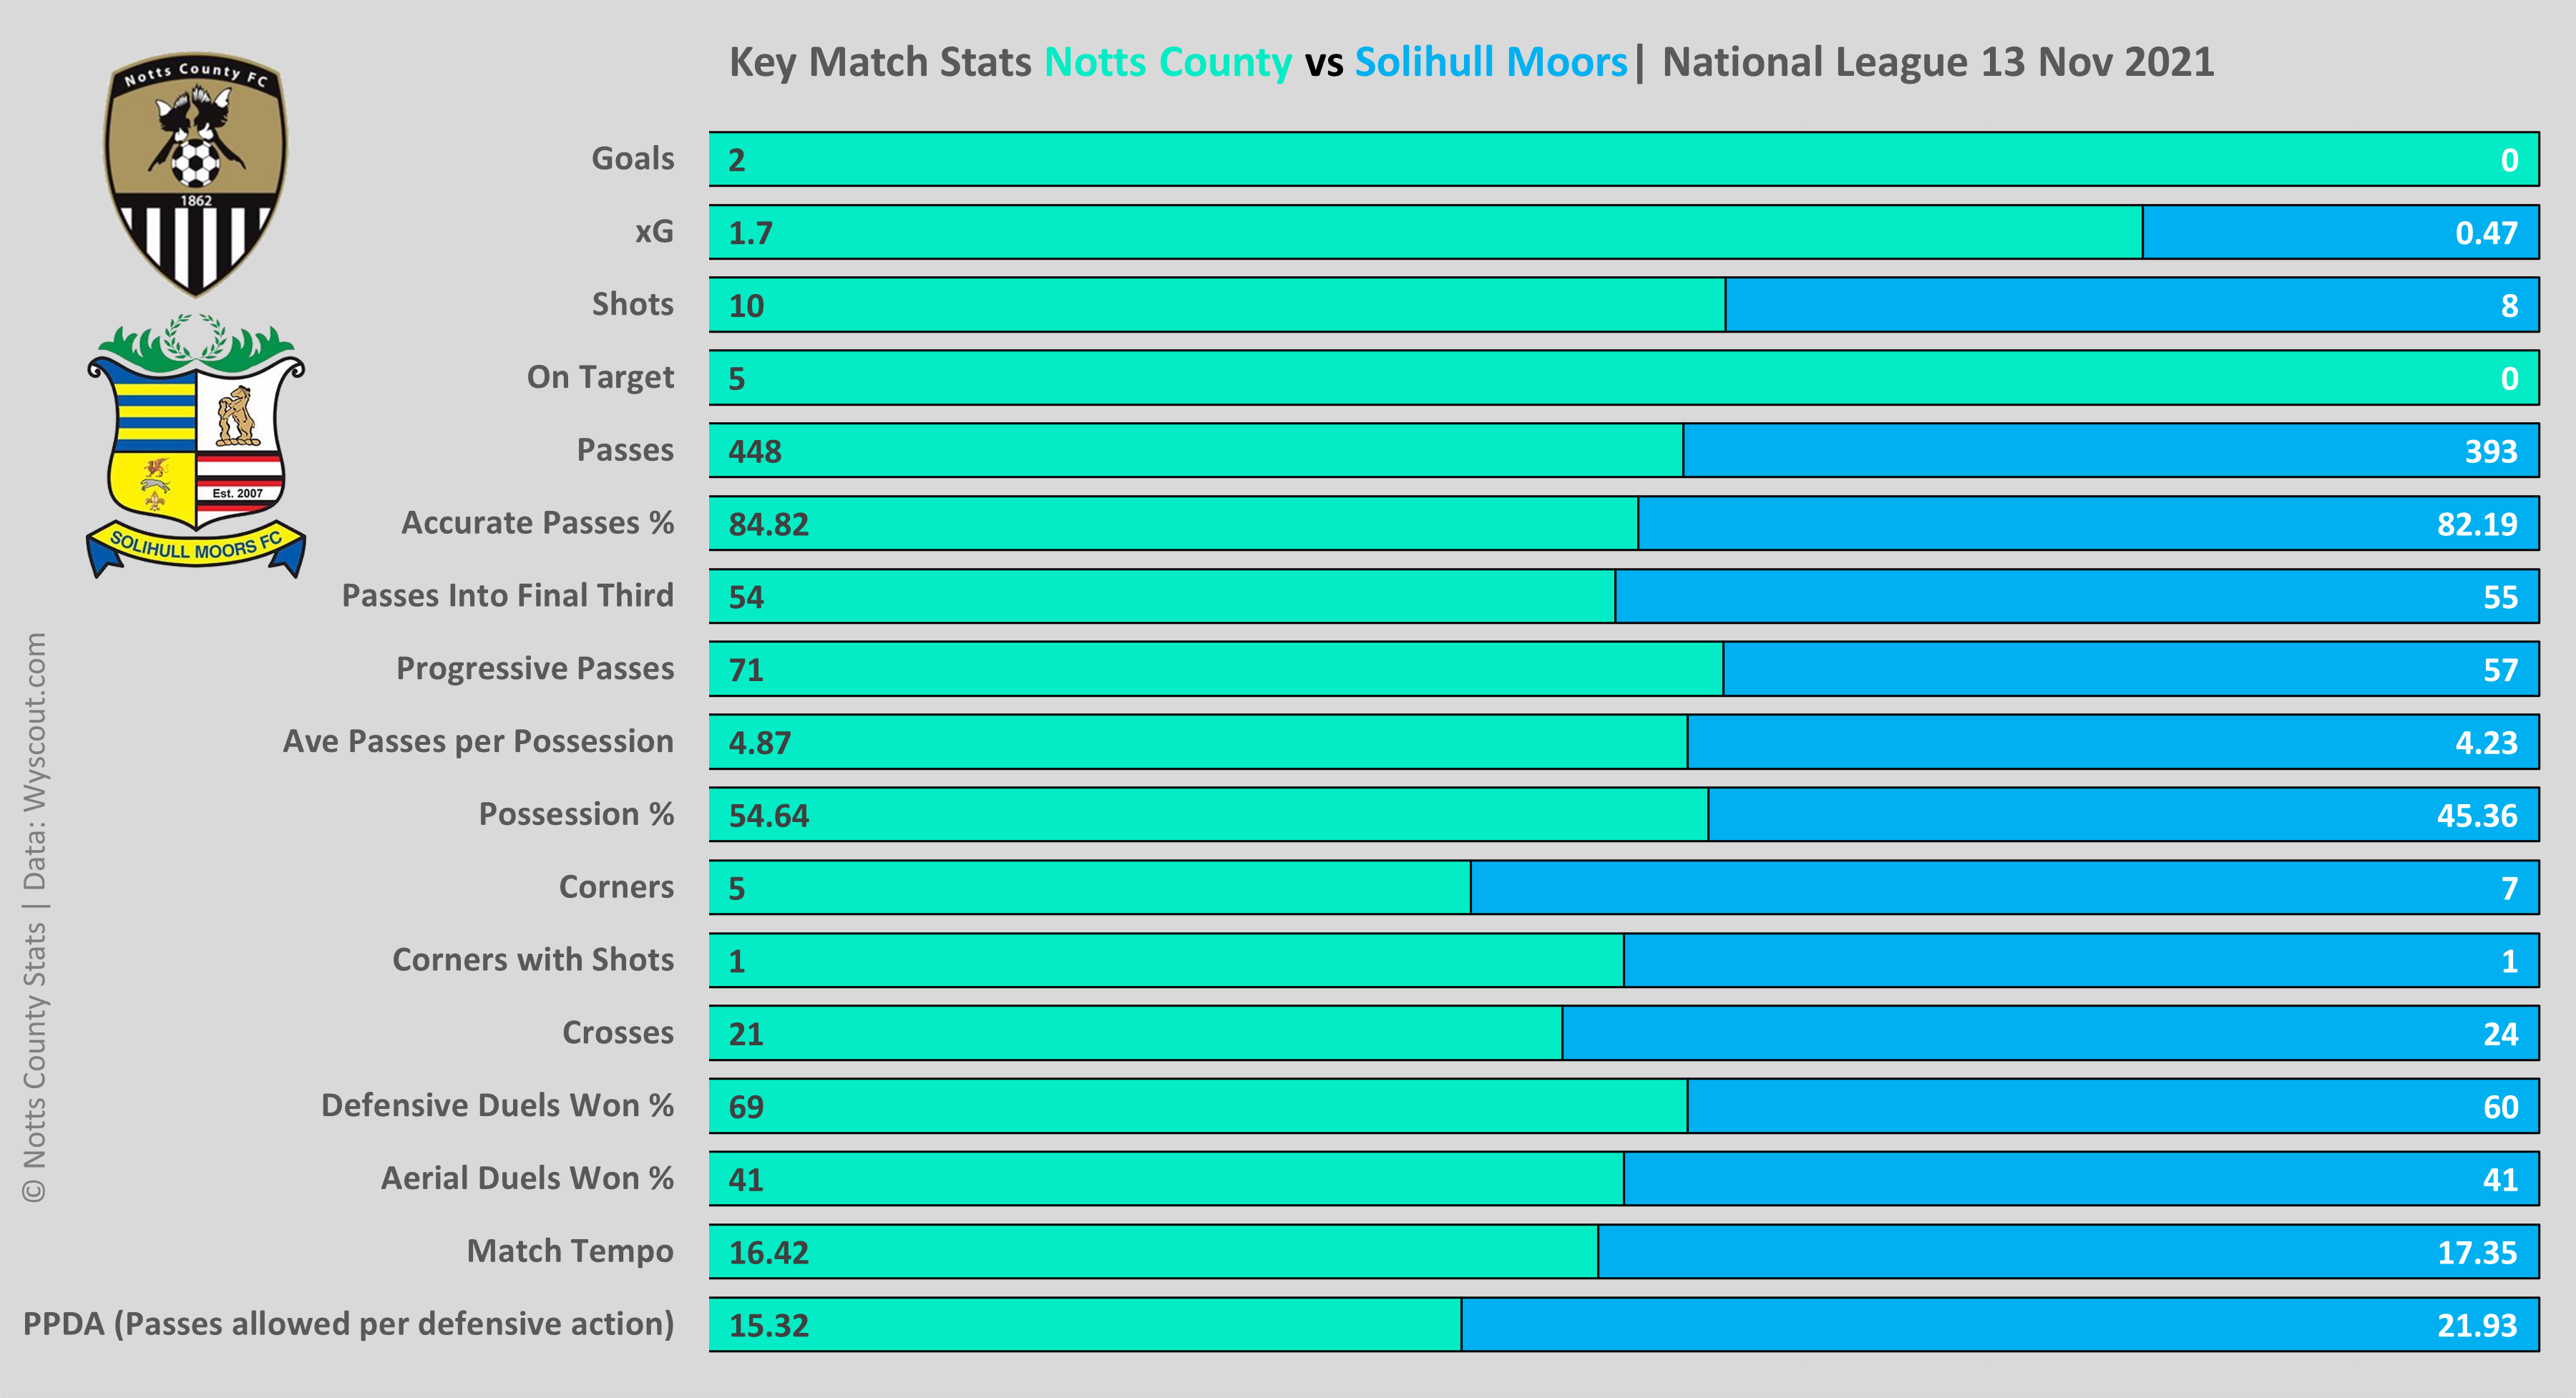
As expected Solihull did their best to match Notts for construction stats, possession, passes etc. However, as mentioned in my match preview the one thing Notts could do to unlock the Moors less than charitable defence would be their progressive actions which was typified by the opening goal.
Ian Burchnall mentioned in a recent interview that it was important that his teams defend from the front and attack from the back and we can see from the stats above that's exactly what his players are doing.
Notts have started to reap the benefits of a high press, the one thing that was so often their nemesis in the recent past has become one of their biggest strengths. Looking at the PPDA for both teams Notts clearly pressed the most when out of possession restricting Solihull to just over 15 passes per attacking action. By contrast Solihull allowed Notts nearly 22 passes per attacking action, clearly not pressing anywhere near as much.
Additionally, Notts recorded a higher number of progressive passes culminating in high value chances ensuring they were a constant threat in the final third.
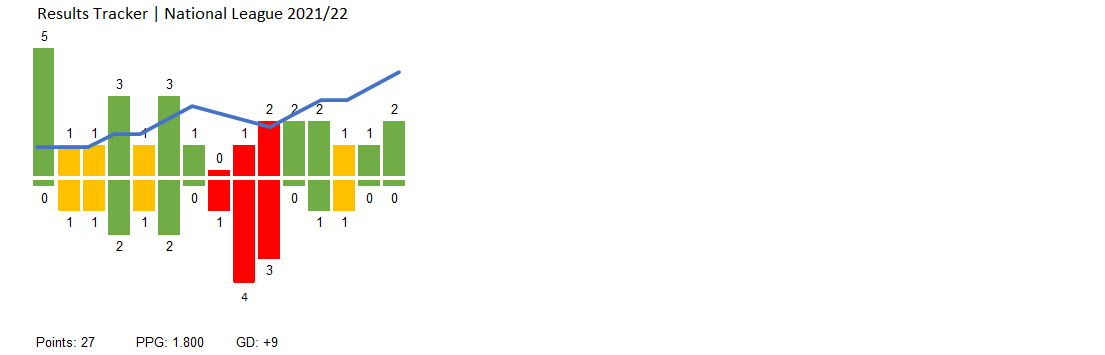
Points needed updated and 1.860 PPG on average would historically see a top 3 finish if sustained. Click on the legend tags at the top to filter options.
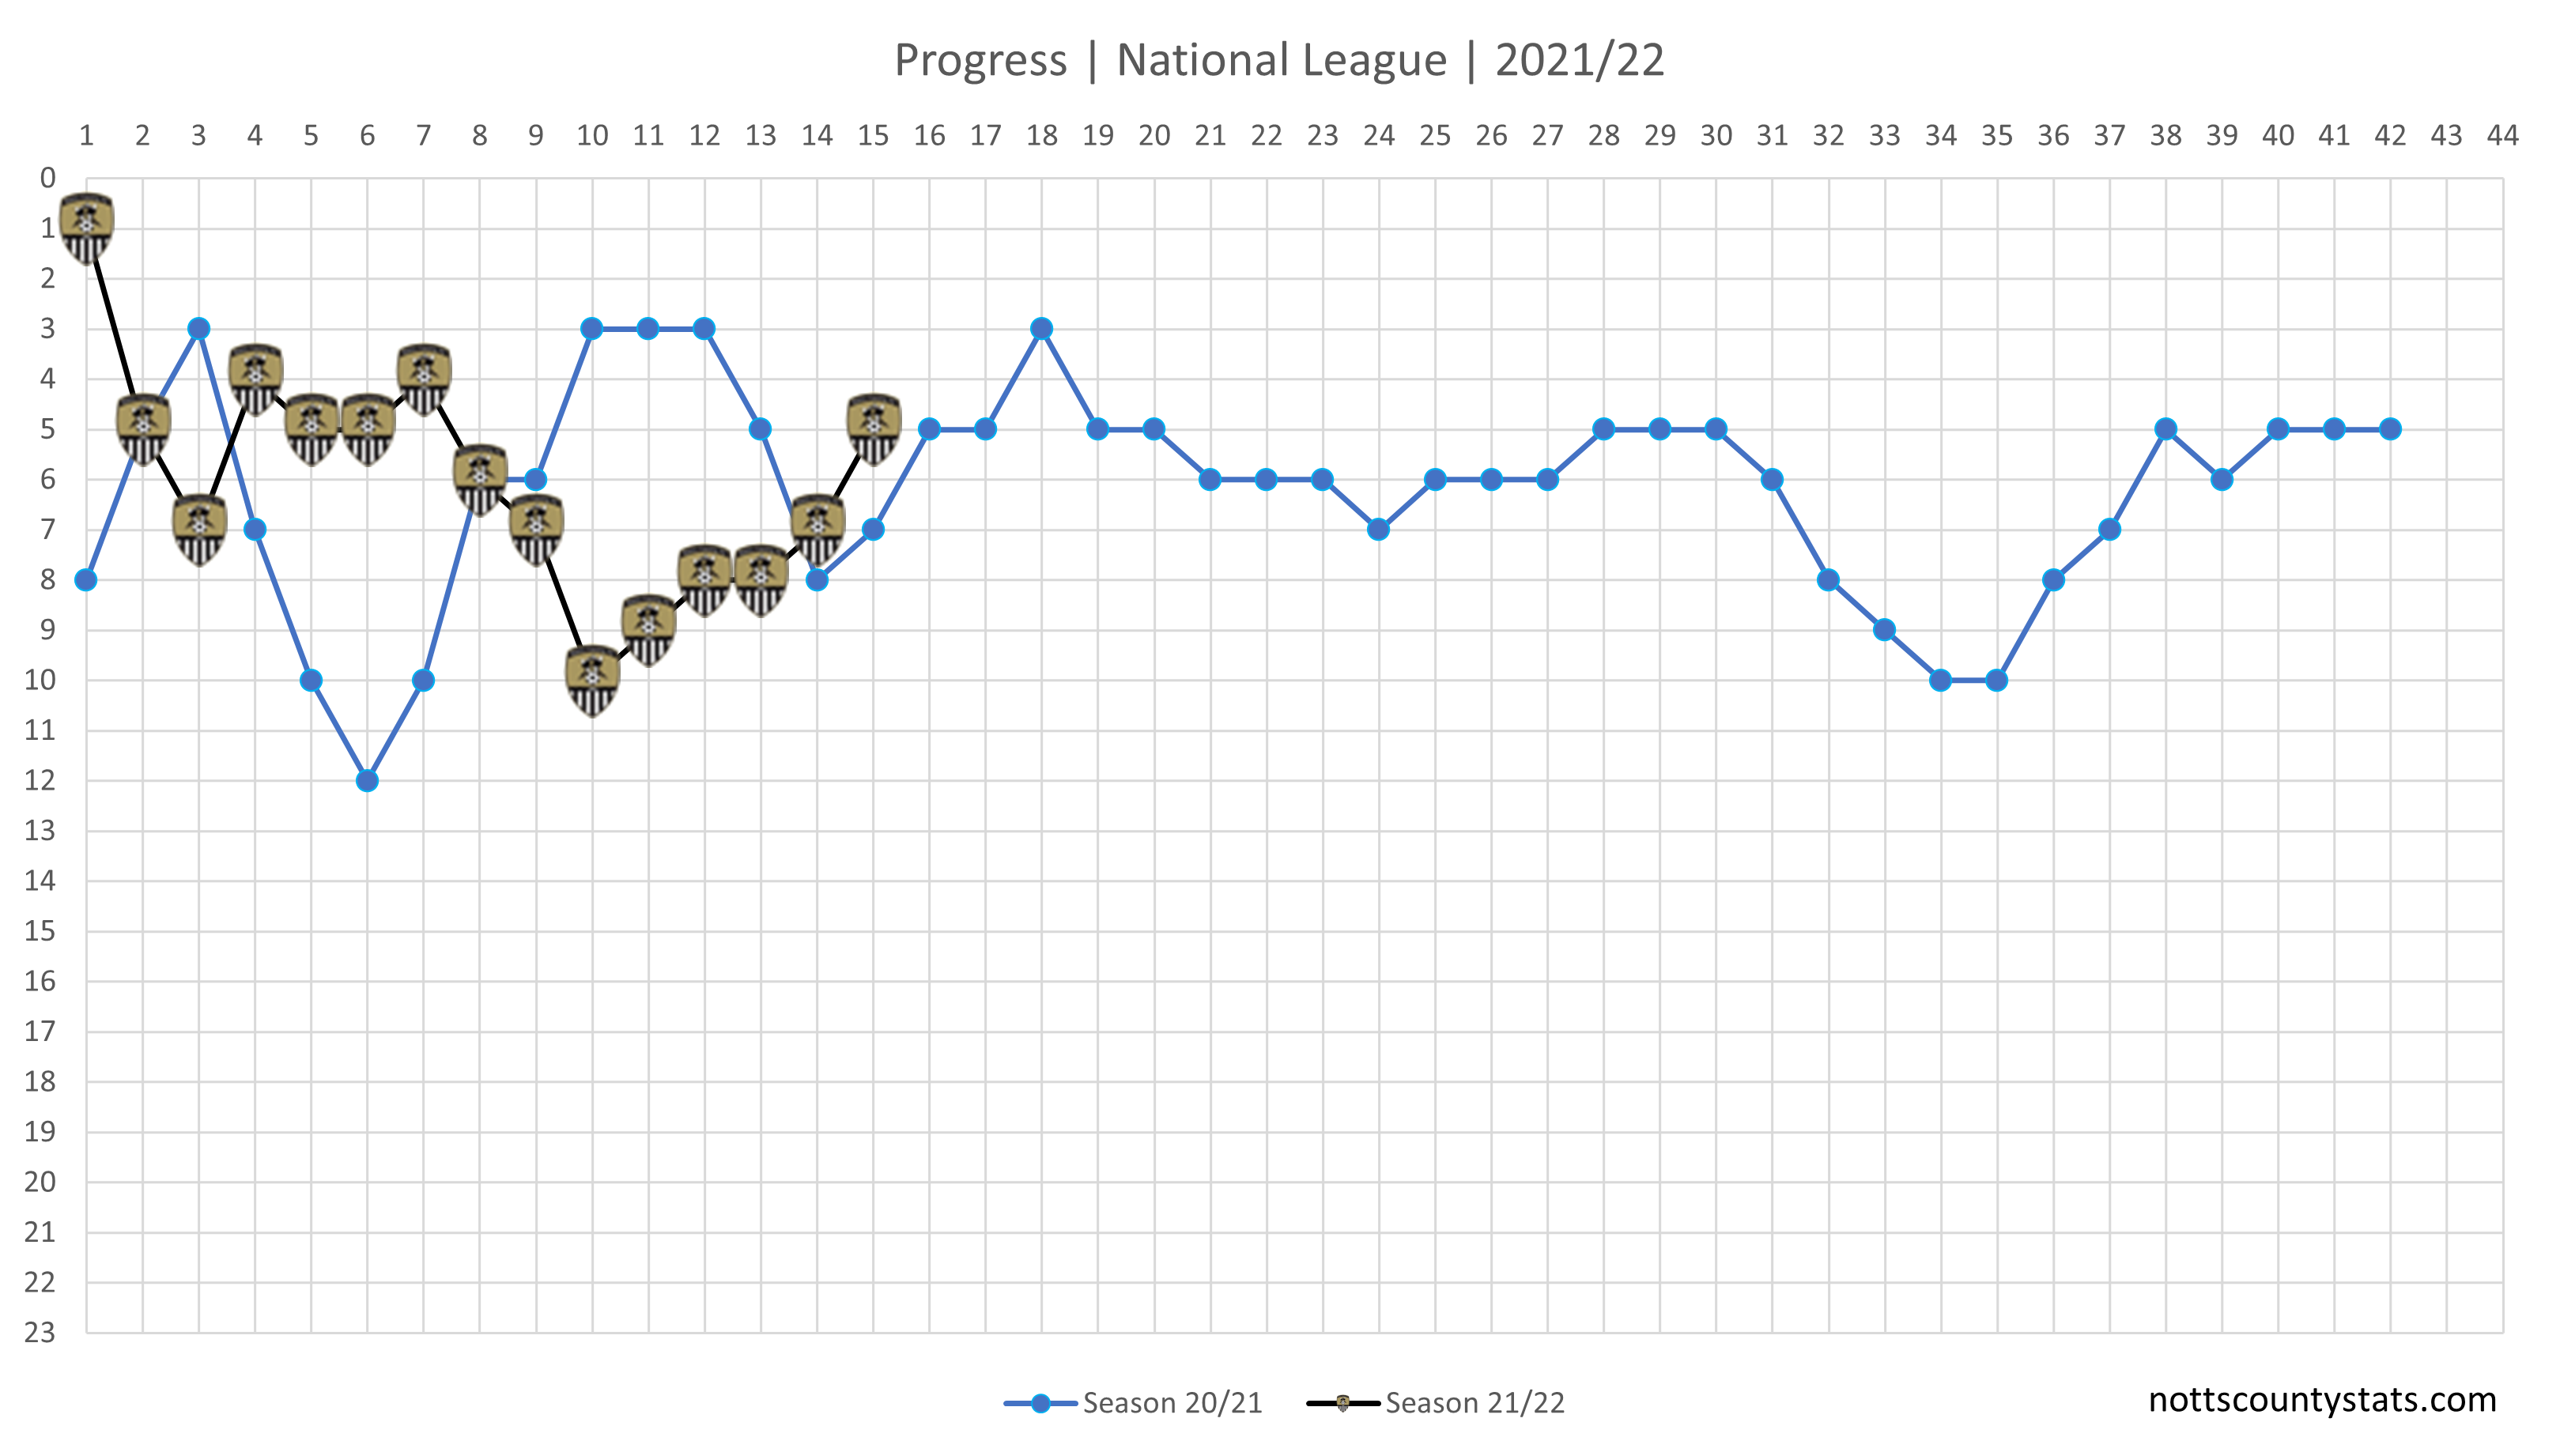
Progress updated. The win saw Notts move up to 5th place.
National League results tracker updated.
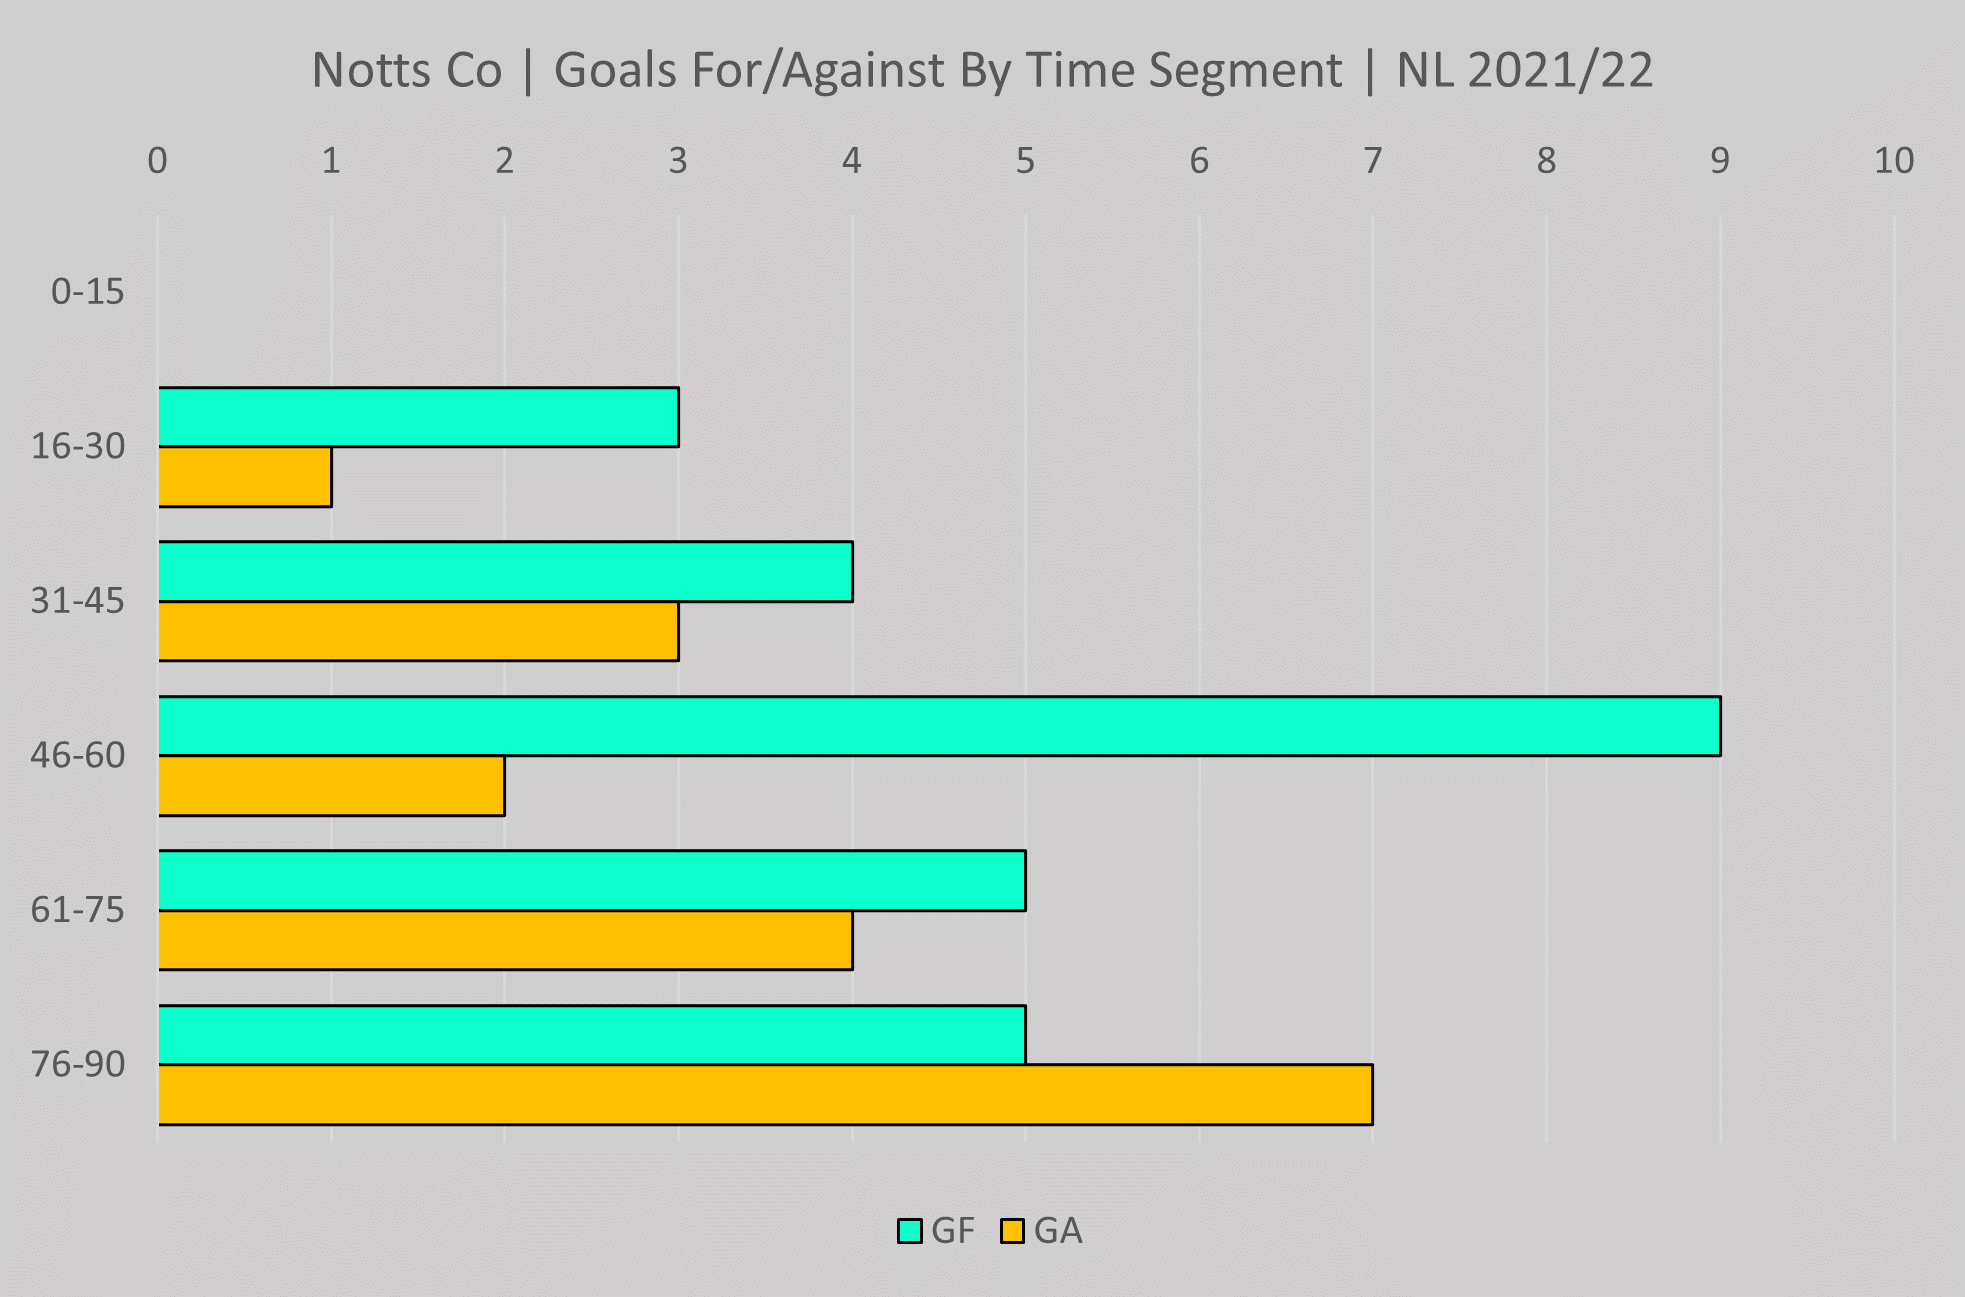
Goal segment chart updated.
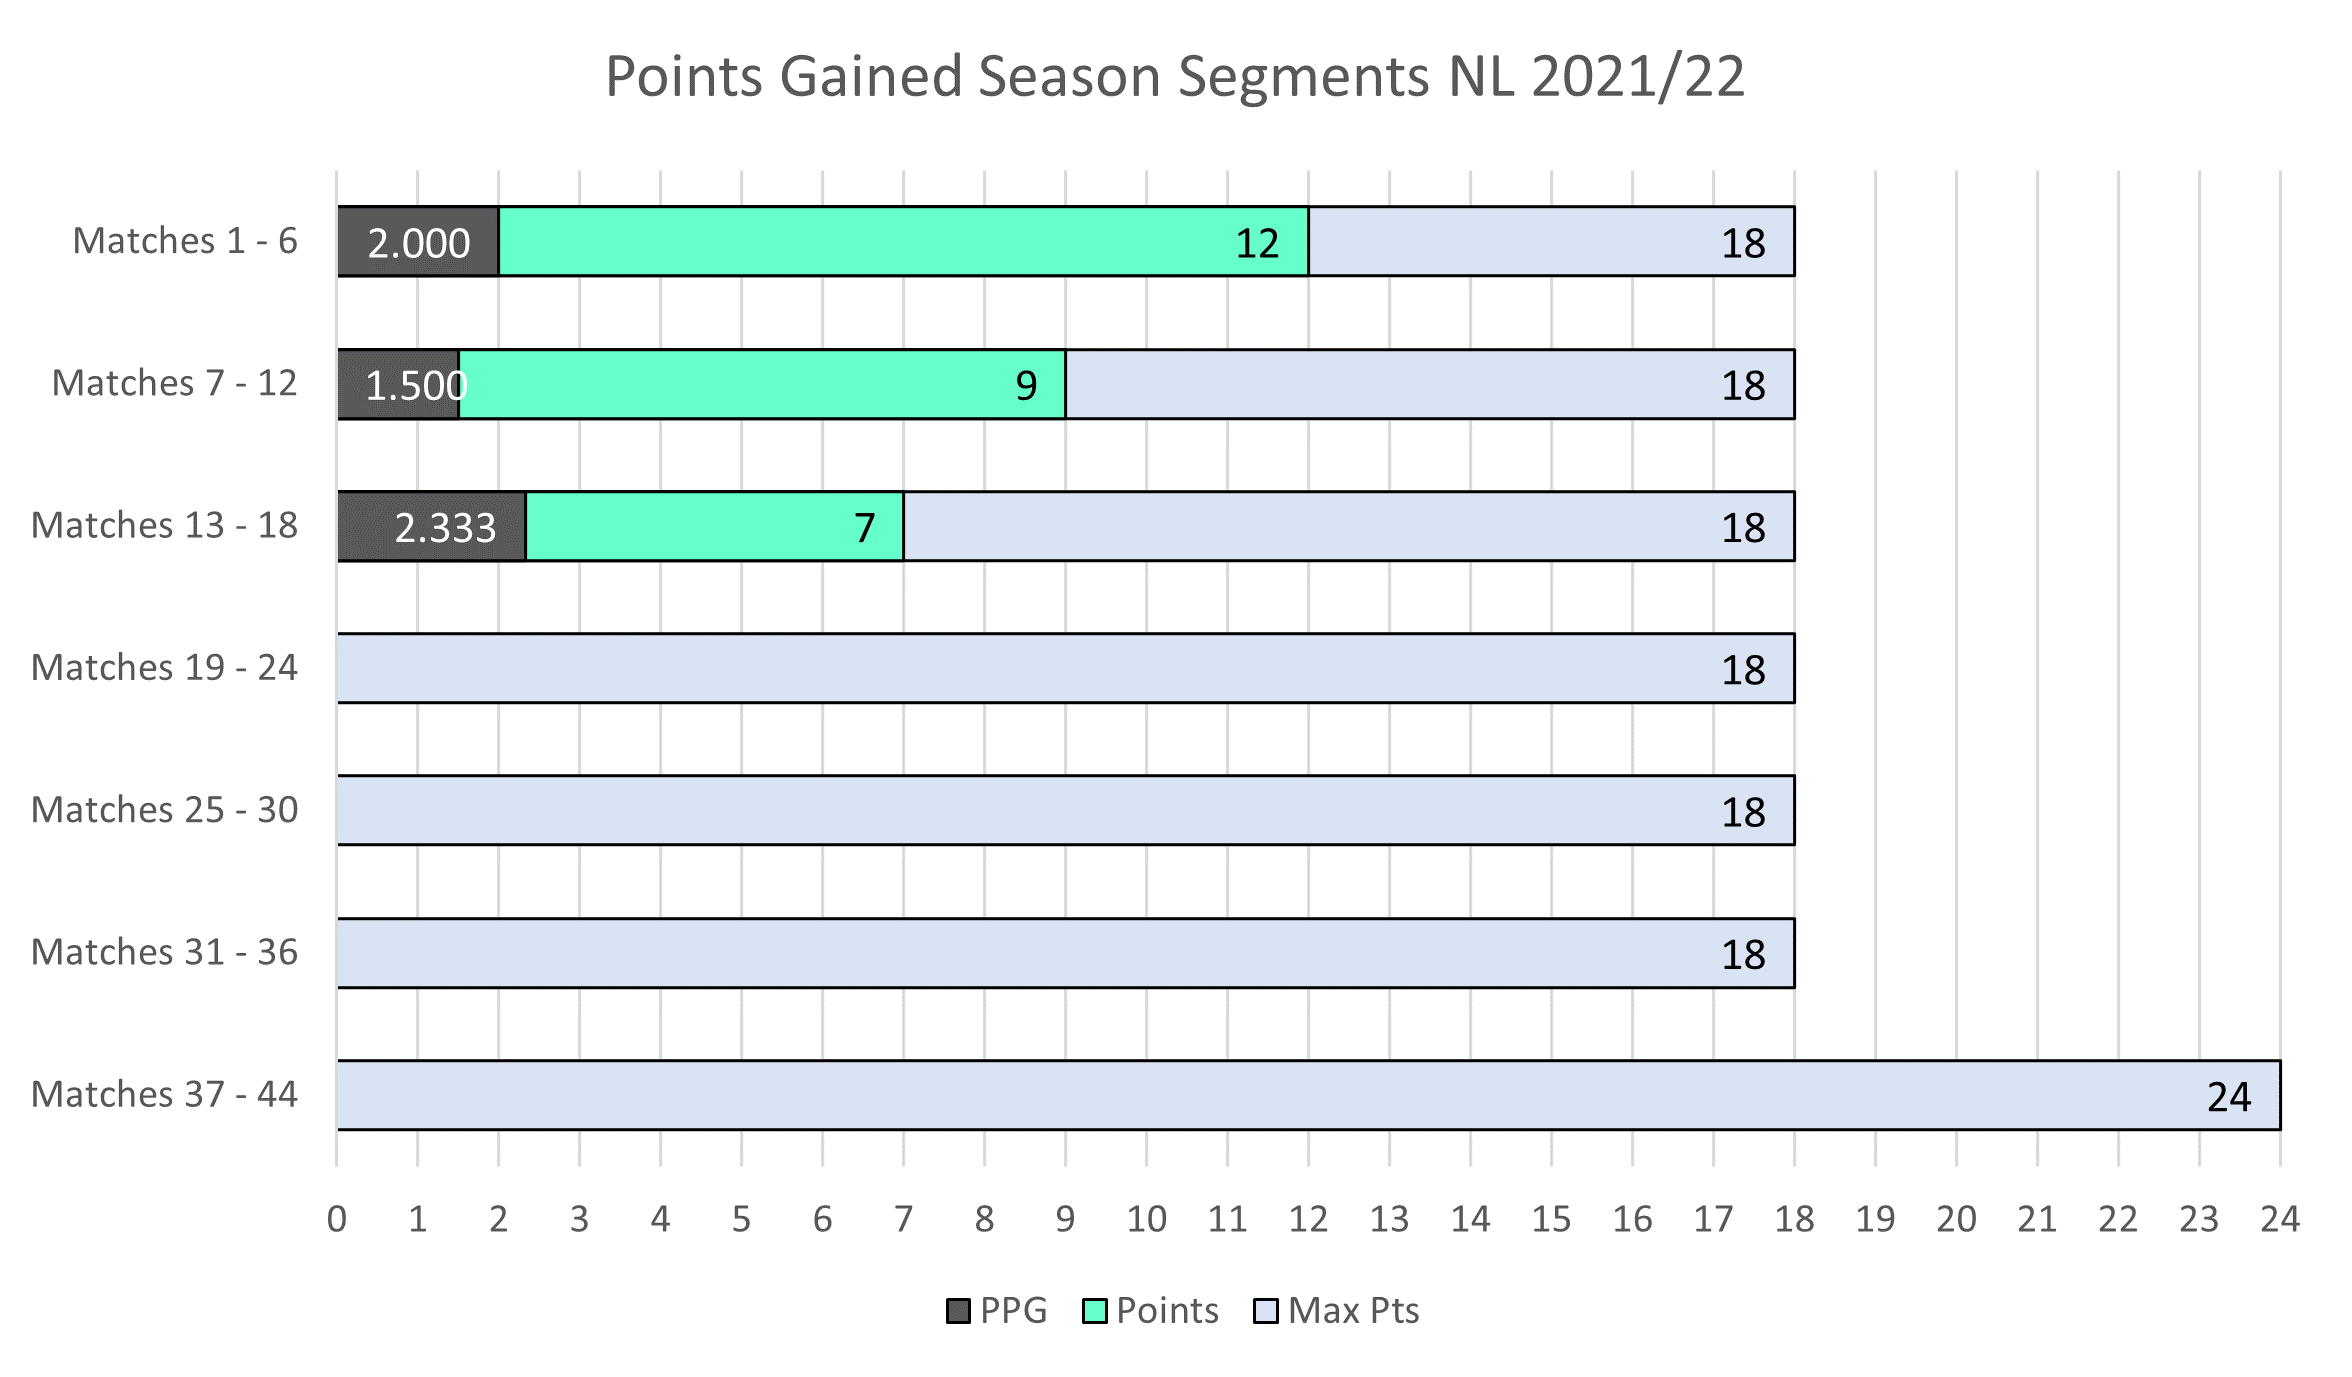
Six game segments updated. 2.333 PPG average for the first three games of this six game segment.
Player stats next and this is the new table that is also available to view on the player stats page of the website here. There will also be separate tables for the two cup competitions.
Goals and assists chart updated for all competitions.
Goal scatter chart. It's clear to see how Notts' philosophy of creating chances in the opposition box is starting to pay dividends with 26 of 31 goals scored in all competitions so far being converted inside the the penalty area.
Expected goals.
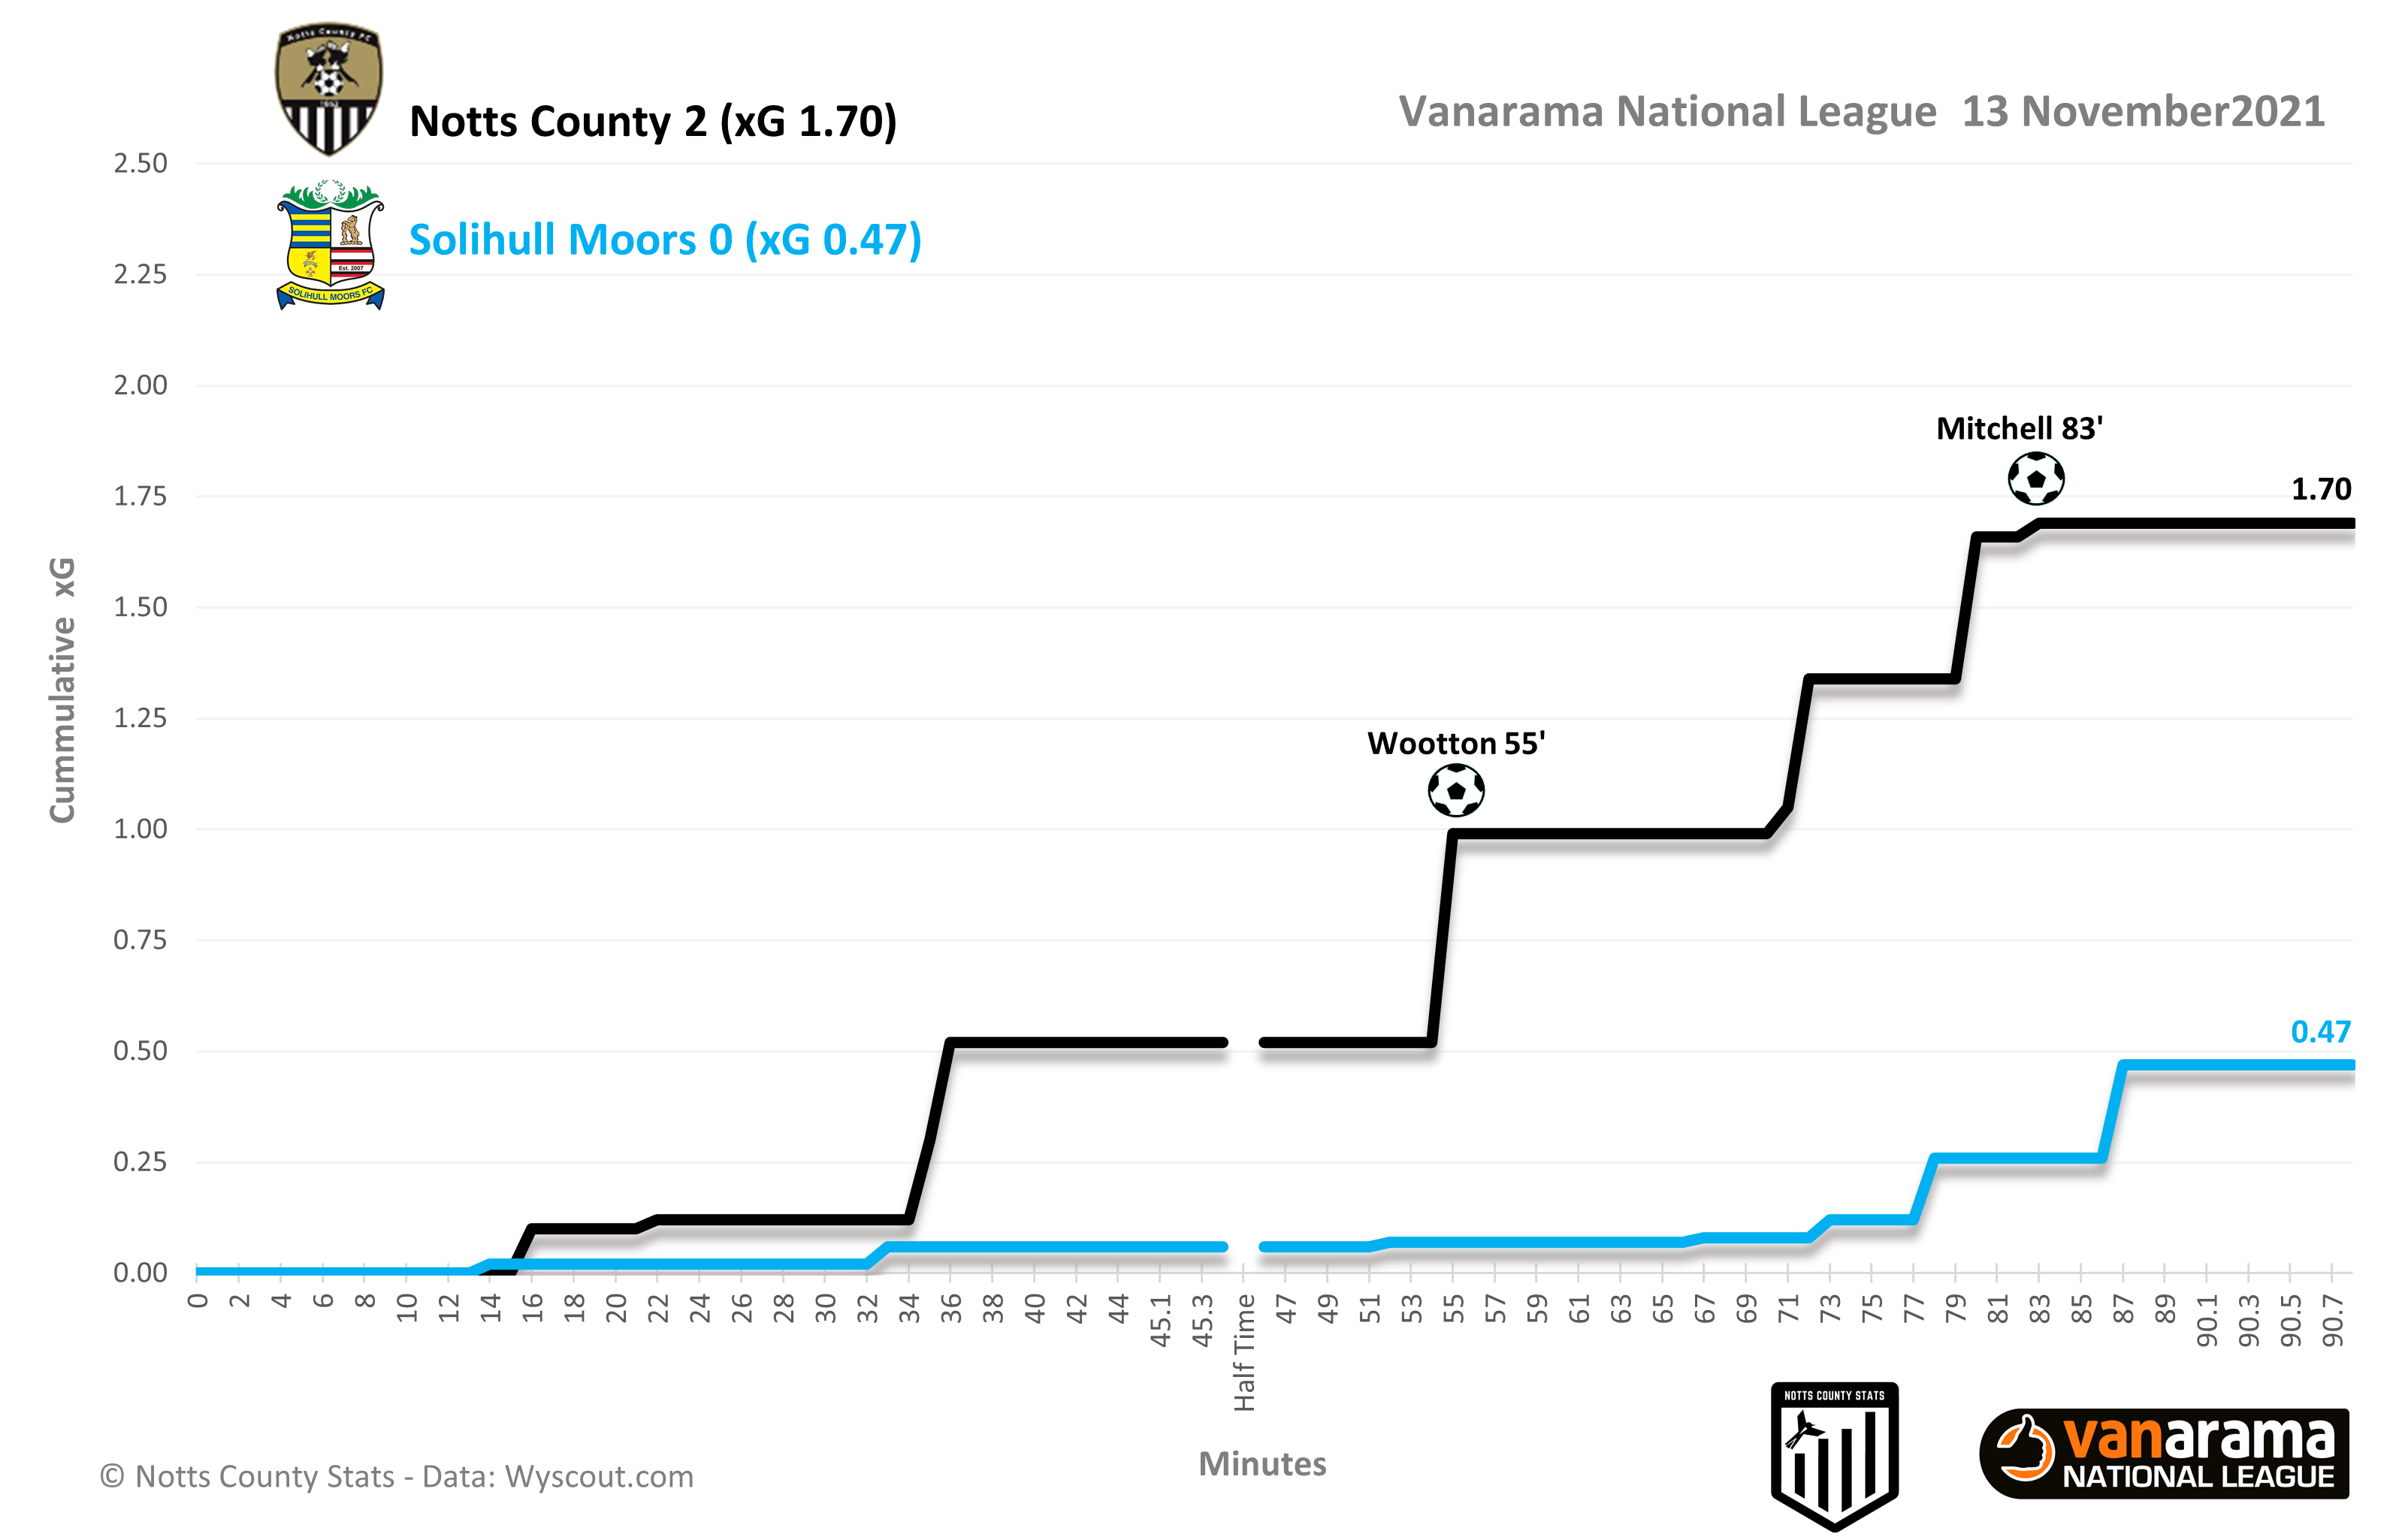
The xG visual above provides a clear example of how Notts are creating high value chances. This increases the likelihood of scoring. Solihull had 8 attempts on goal but only one of those provided a real chance of scoring, a near post header by Joe Sbarra on 87 minutes.
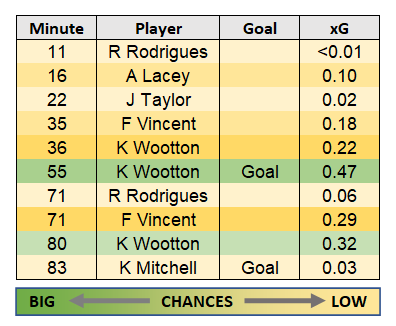
Notts' player xG below, Kyle Wootton and Frank Vincent with the best chances. Also credit to Kairo Mitchell who did really well to convert his chance despite having a low xG of just 0.03.
Match xG and xPTS.
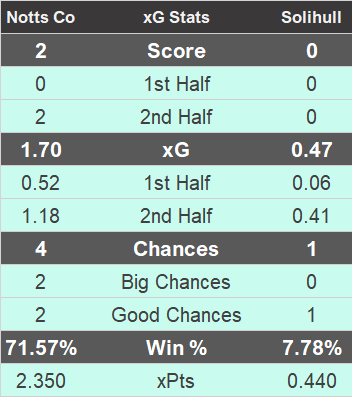
The high value chances created by Notts meant they were most likely to win this game.
National League goal scorers includes cup games, penalties and own goals. Again, it's an interactive table so use the search bar to drill down on specific players or teams and click on the column headings to toggle high-low or low-high.
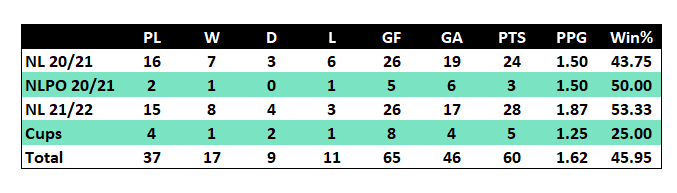
Ian Burchnall's record updated after 37 matches.
Currently for all competitions Ian's PPG stands at 1.62 with a 45.95% win percentage.
So Rochdale at home tomorrow night in an FA Cup replay that will guarantee the victors an £80k windfall so expect Ian Burchnall to name a strong starting 11.
As always thanks for reading and for your continued support. As mentioned previously if anyone has any questions relating to the stats please feel free to get in touch.
Until next time.
COYP!
Richard
Notes:
PPDA (Passes Allowed Per Defensive Action) - A metric that can quantify the extent and aggression of high presses employed by teams. PPDA = Number of Passes made by Attacking Team (opponent) / Number of Defensive Actions.