
Live television, a late kick-off and Baltic weather conditions did little to deter the 4,889 souls who ventured out to attend what developed to be an open and entertaining game between two good footballing sides.
Amazingly this was Notts' 8th win in a row at home in front of the BT Sport cameras which kind of puts to bed the old live tv curse theory.
Key match stats.
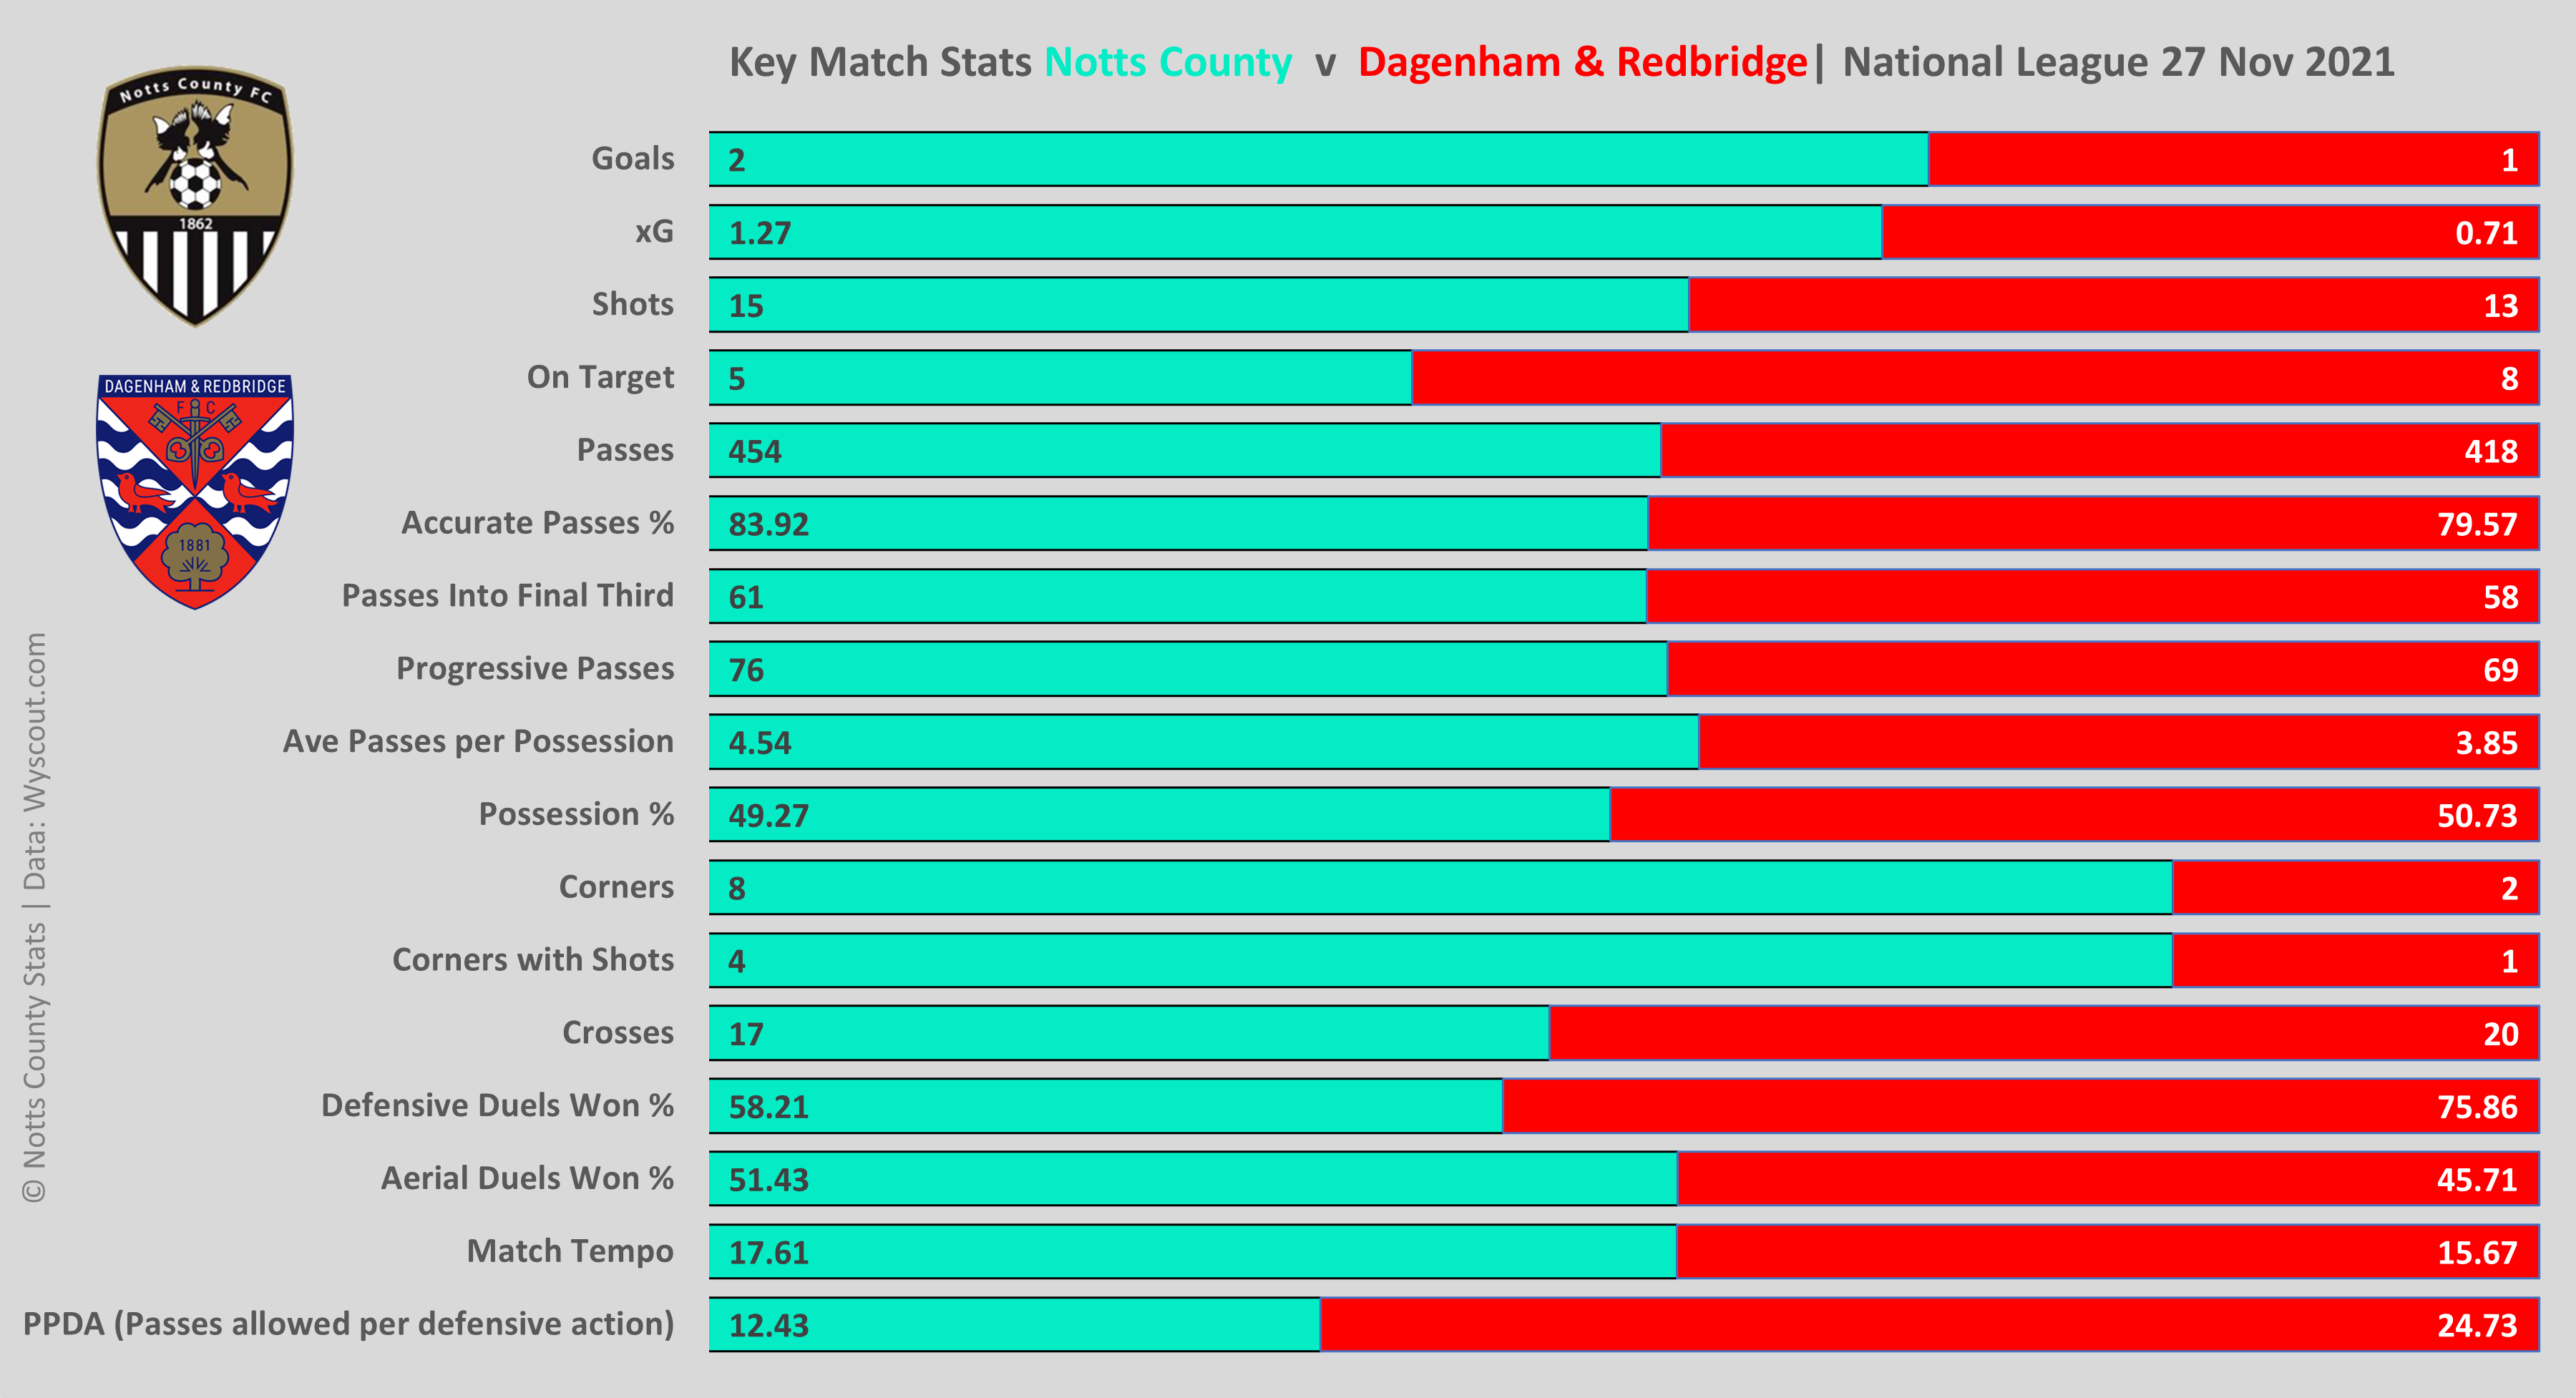
Very even match stats which would concur with what was seen whilst watching the game. However there are a couple of areas that probably tipped the scales in Notts favour.
Firstly "PPDA". Notts' pressing, although not as high as we have seen in other games was definitely more aggressive than Dagenham's with Notts being allowed nearly 25 passes in the build up compared the visitors being restricted to just over 12 passes in the build up by the Magpies.
Secondly Notts played at a higher tempo than Dagenham, in fact it was the second highest match tempo recorded by Notts in the league this season.
There is also one other area to mention that isn't identified above. Notts high press and desire to get the ball into the last third meant that their average shot distance was in and around the penalty area at 18.23 metres. By contrast Dagenham were restricted to shots from further out averaging 21.65 metres per shot meaning their chances on the whole were going to be less of a threat and of a reduced chance value.
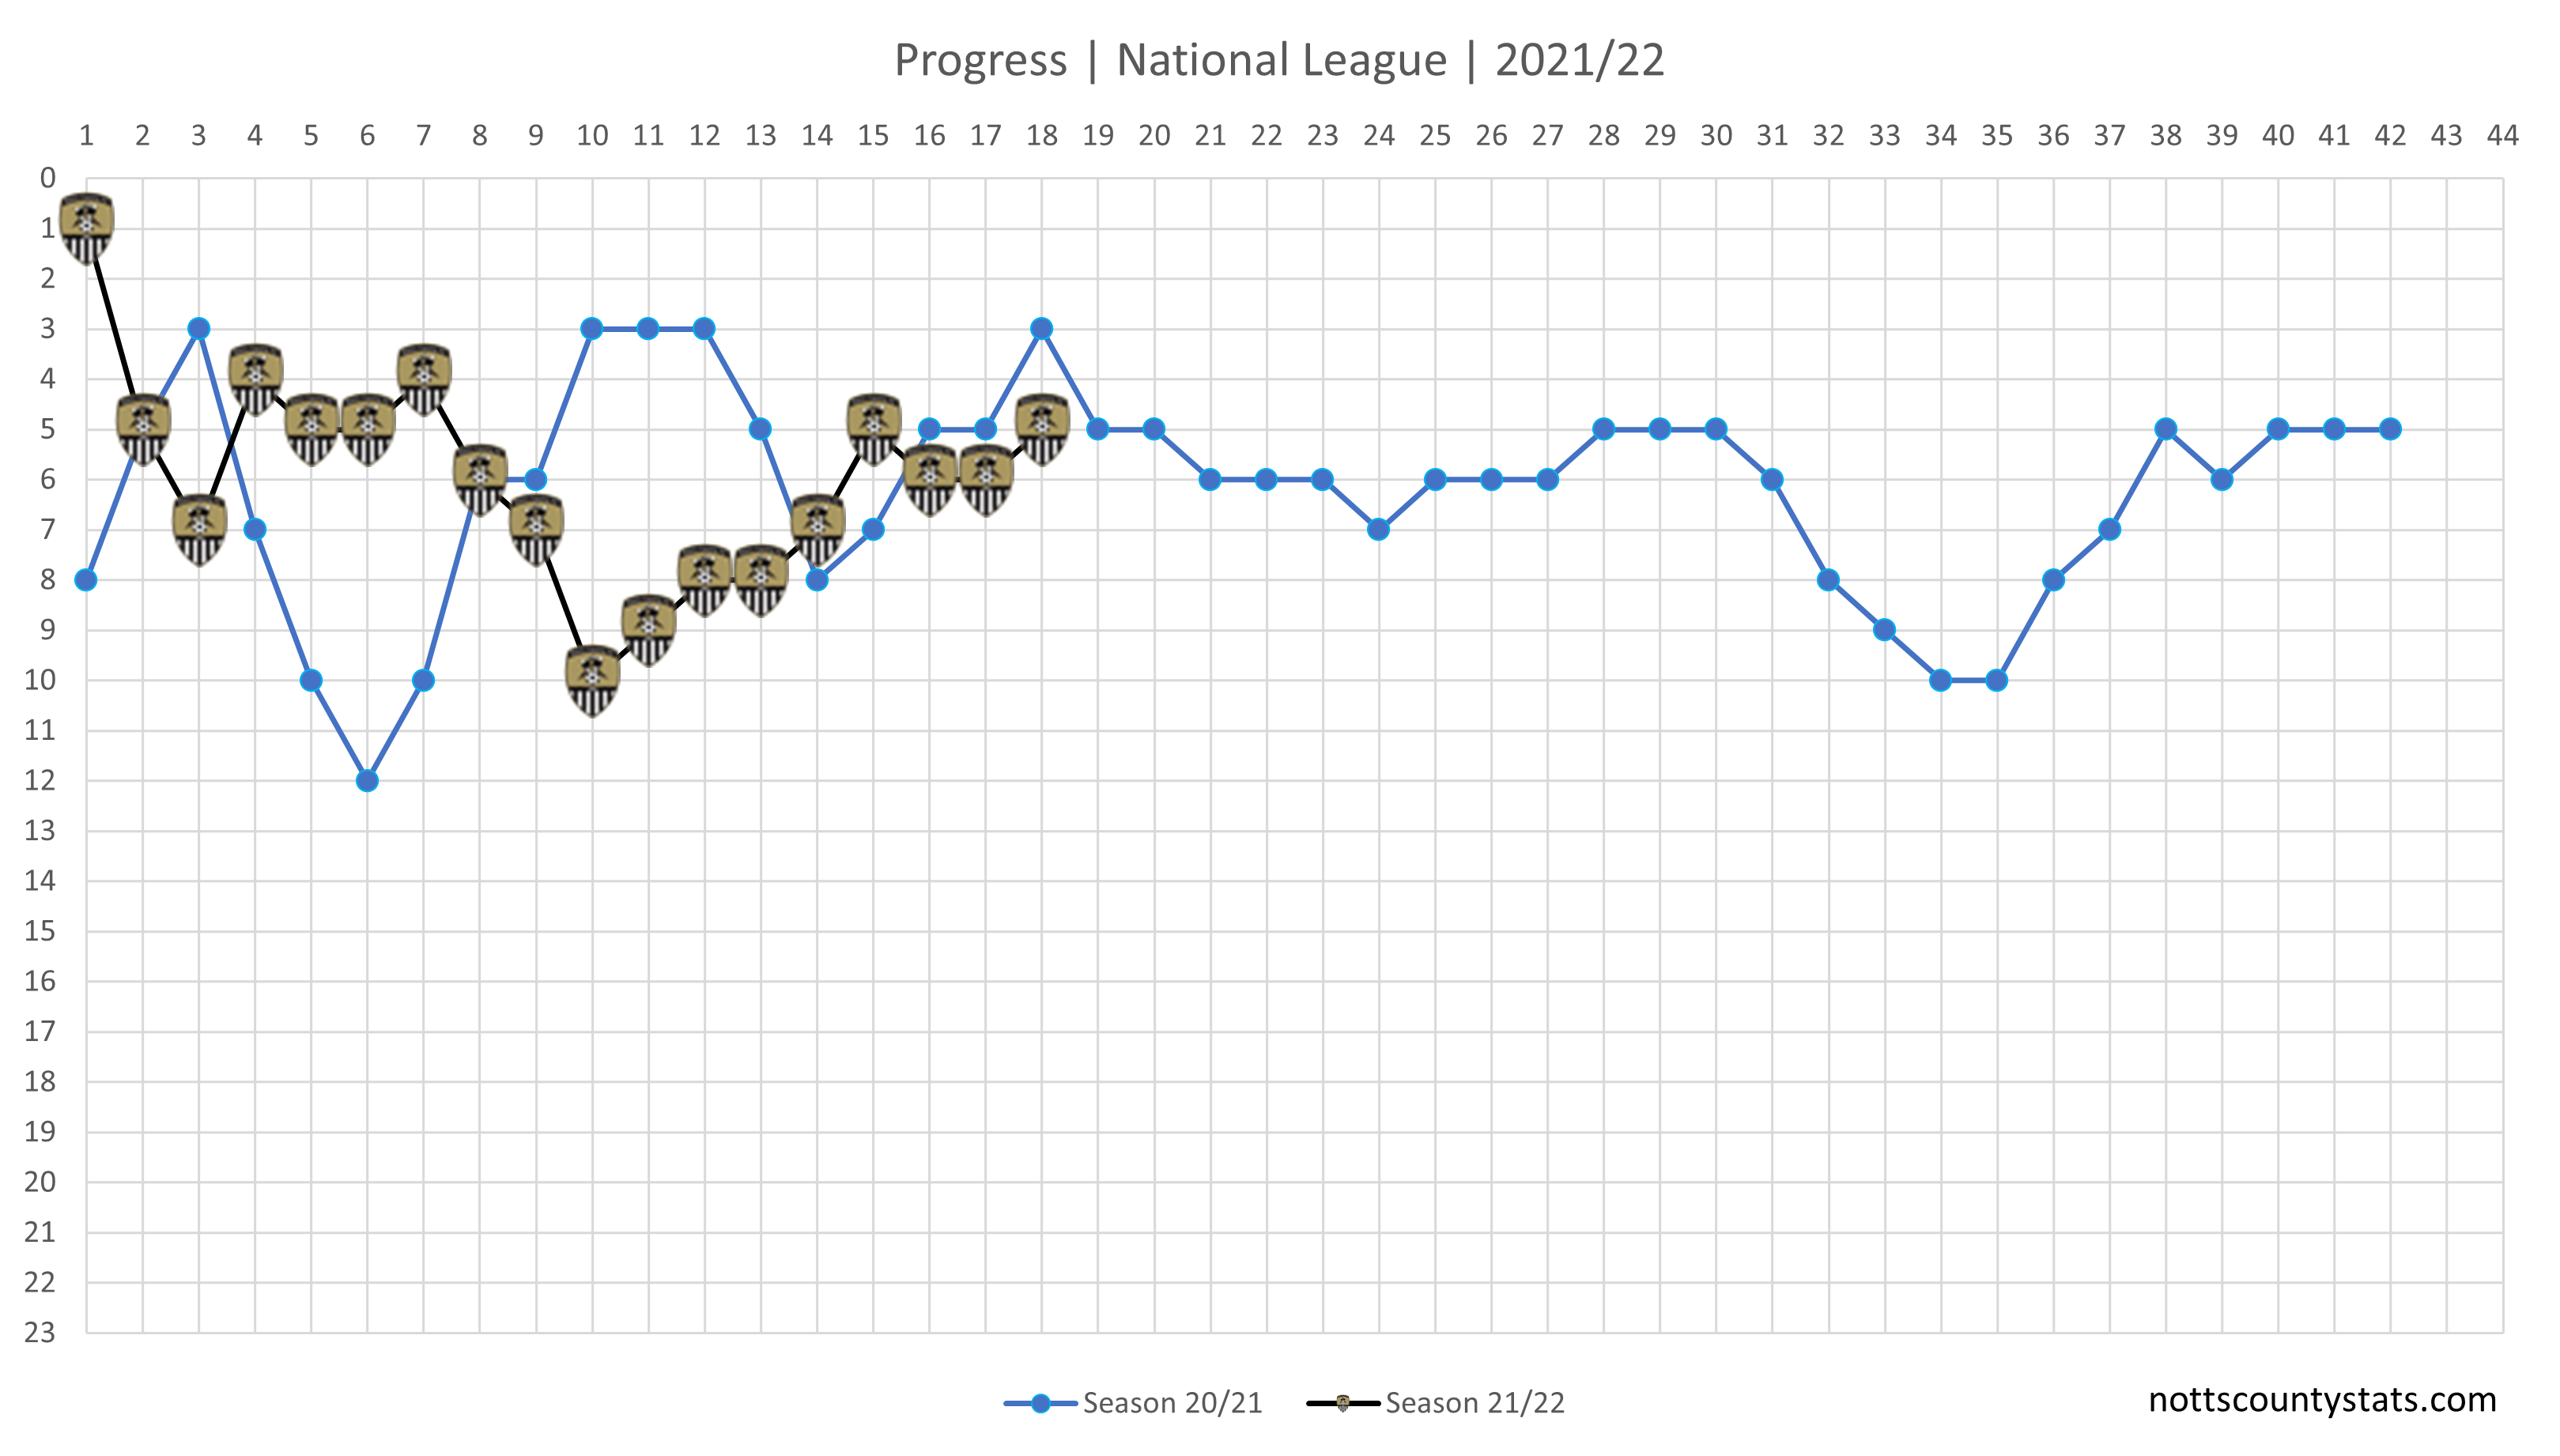
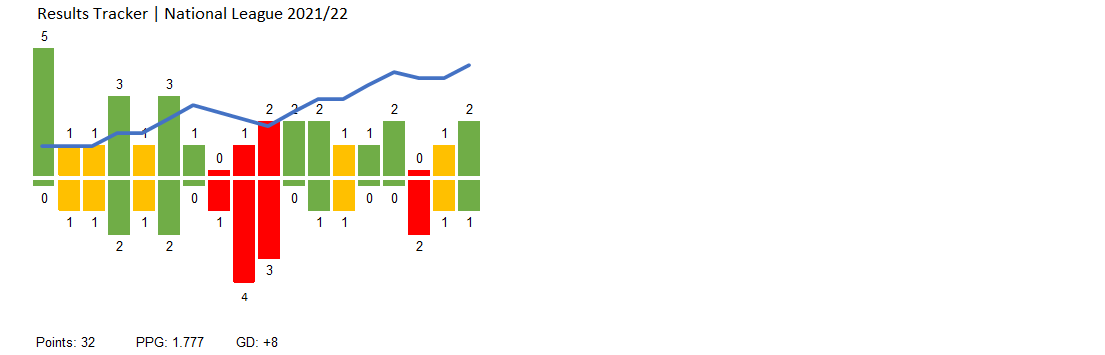
Points needed updated and 1.777 PPG on average would accrue 78 points and historically see a top 3 finish. Click on the legend tags at the top to filter options.
Progress updated and having dropped a bit after the earlier games a move back up to 5th place.
National League results tracker updated.
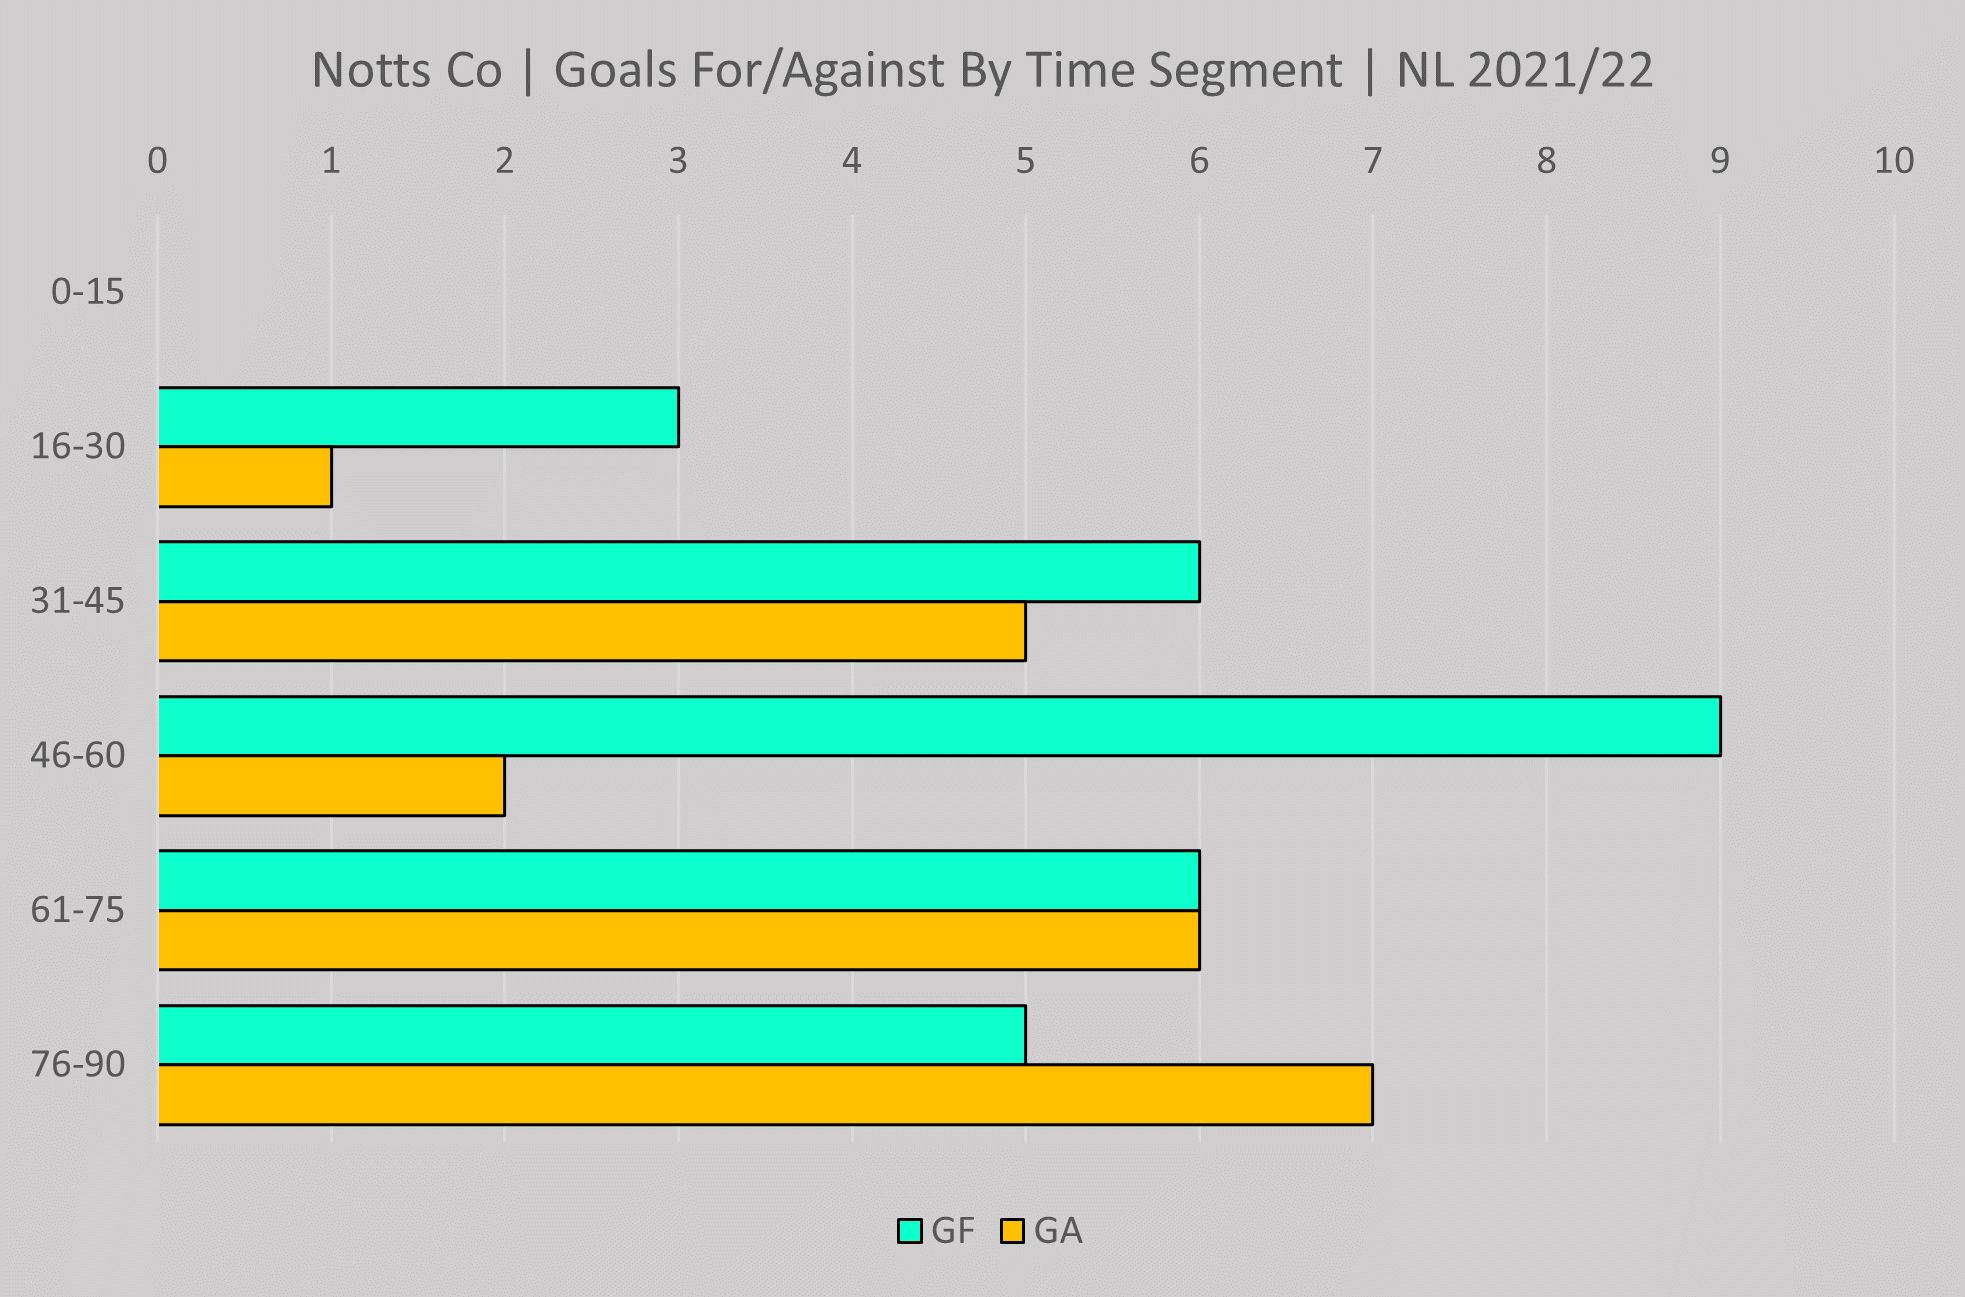
Goal segment chart updated and 70% of all goals in Notts games in the league coming in the second half.
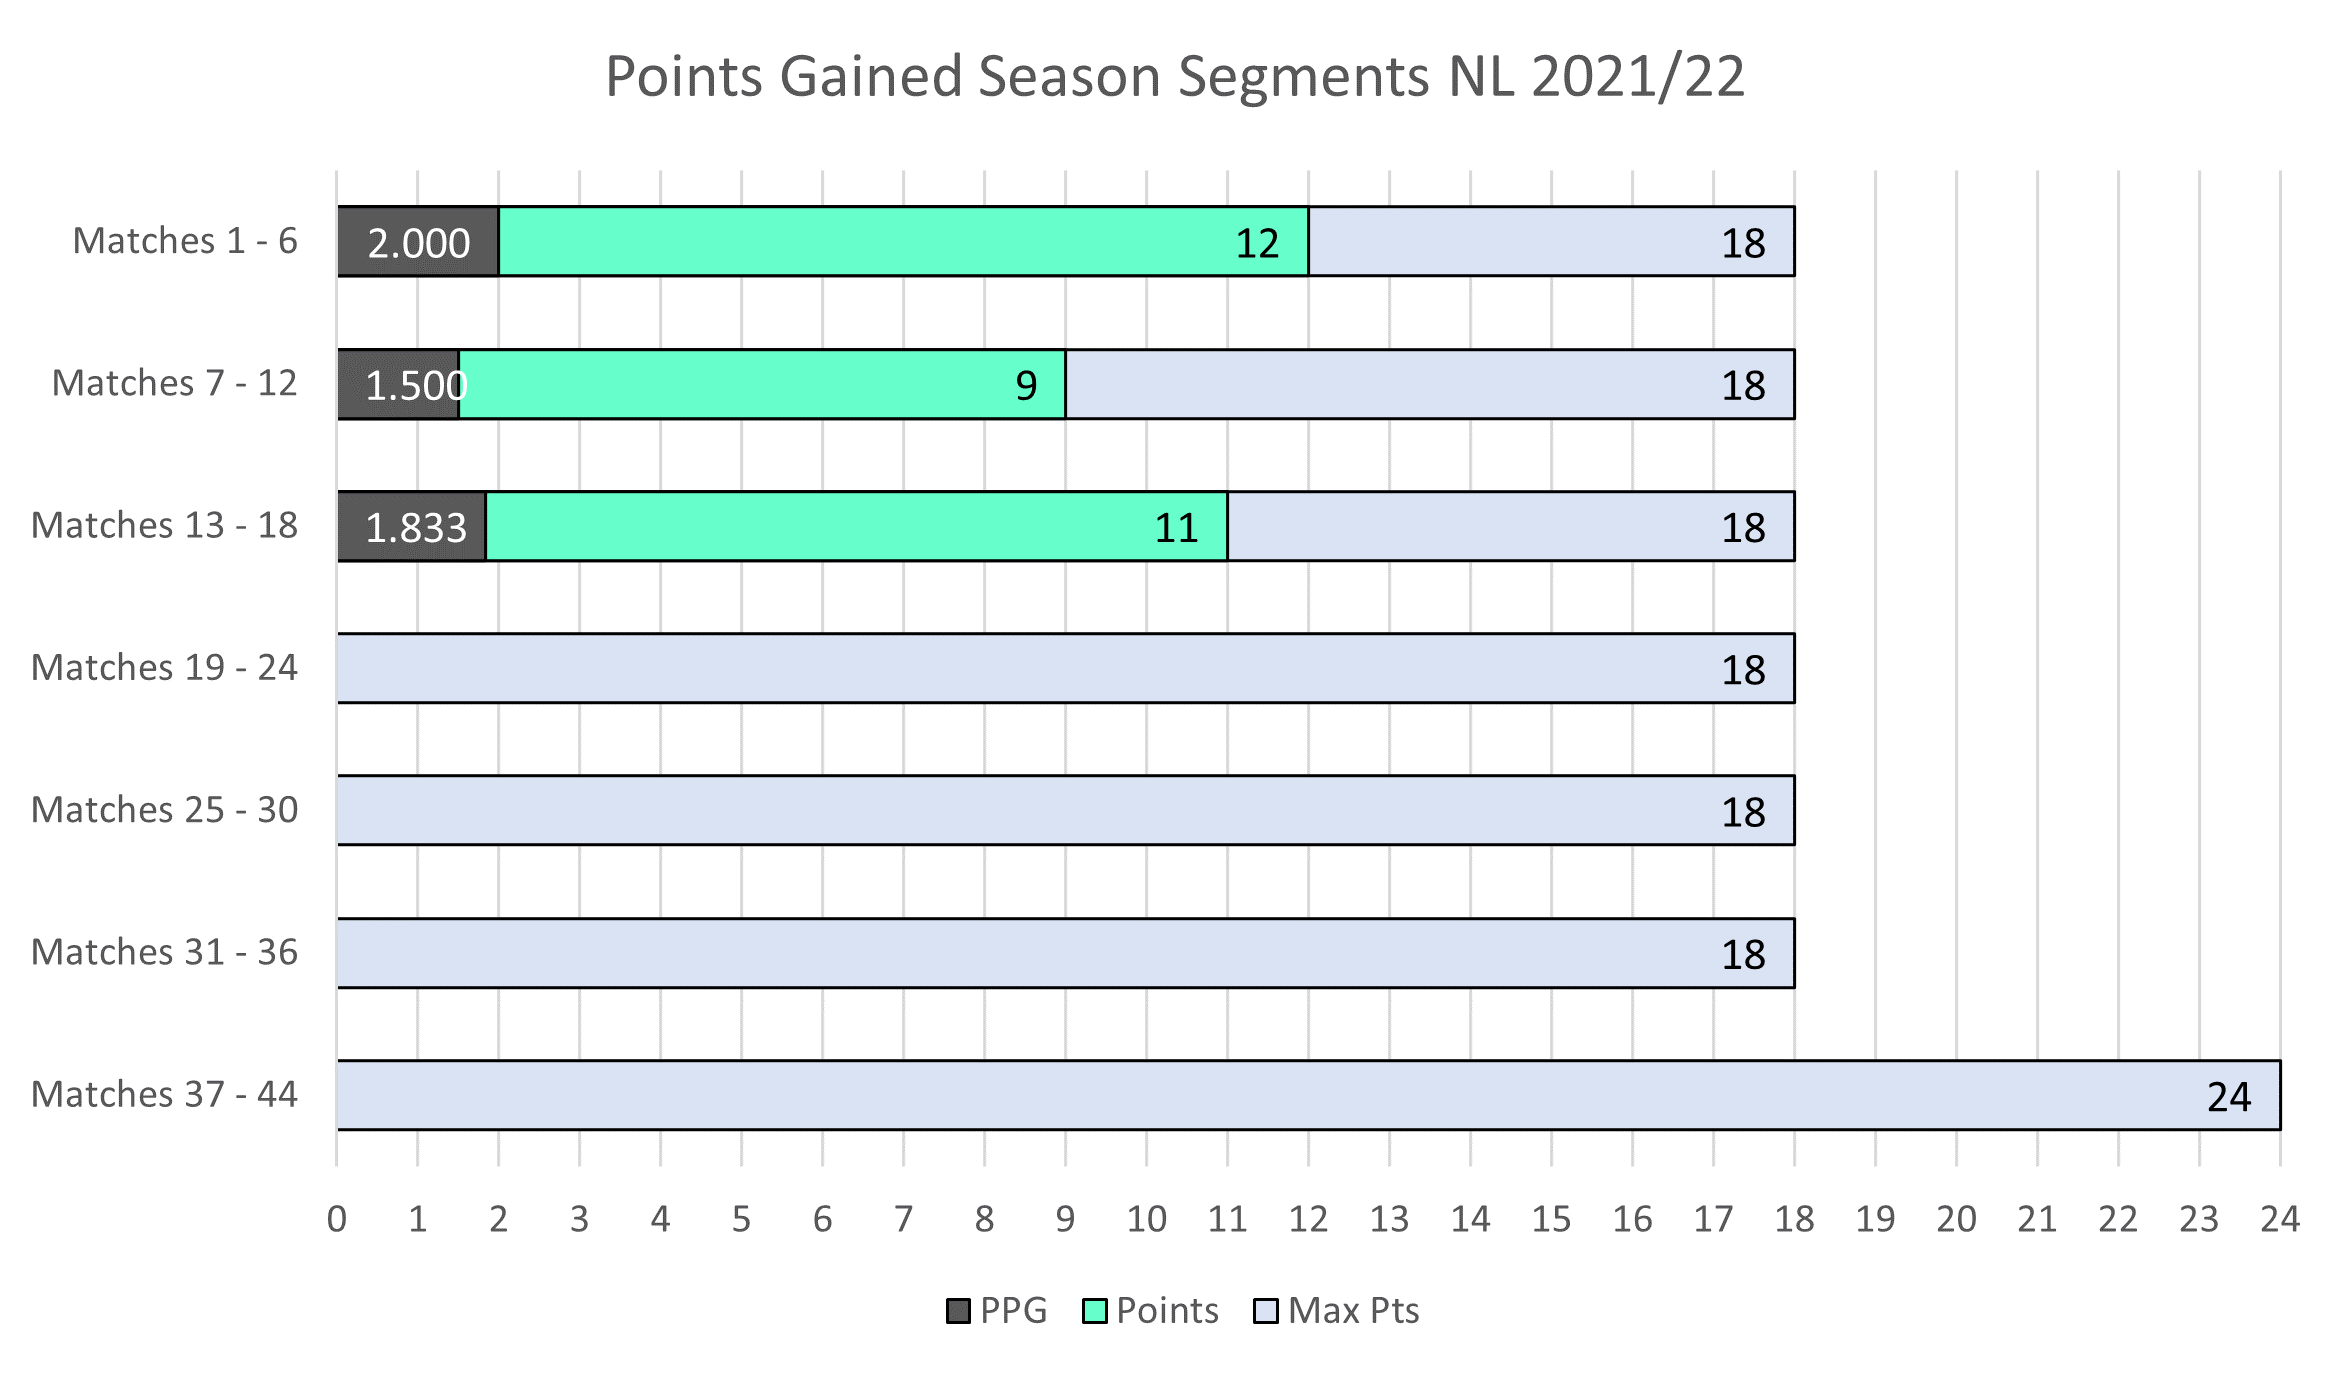
Six game segments updated and 11 points gained at a PPG of 1.833.
Player stats next. As usual this is the new table that is also available to view on the player stats page of the website here. There will also be separate tables for the two cup competitions.
Kyle Cameron just shading it still on PPG at 2.07.
Goals and assists chart updated for all competitions. Ian Burchnall's philosophy of defend from the front, attack from the back hasn't been lost on Kyle Cameron!
Goal scatter chart. You can hover on the dots (tap if on a touch screen) to view details for each goal.
Expected goals and a slight contrast to the Boreham Wood game.
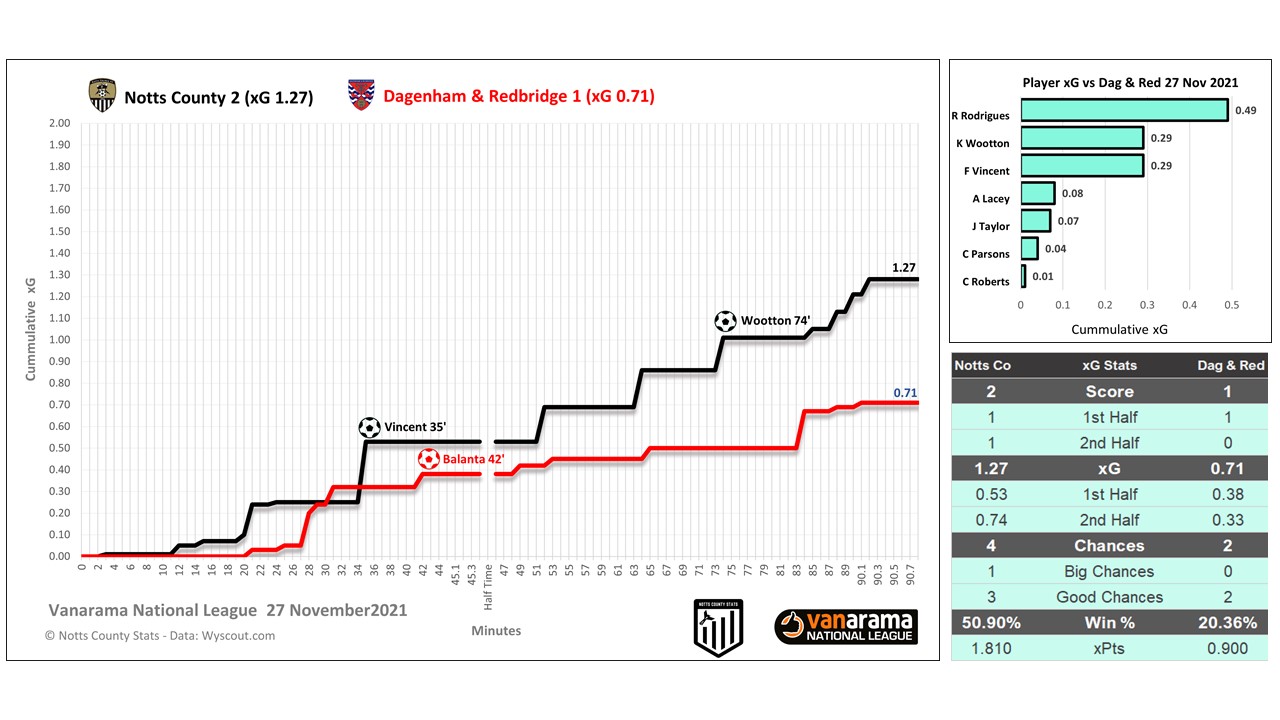
As mentioned when analysing the match stats earlier Notts' objective of creating chances in the penalty area means the xG value will be higher.
7 Notts players with attempts on goal against Dagenham with Ruben Rodrigues recording the highest xG value for the game, undoubtedly helped by 'that' header.
Nice to see Frank Vincent contributing and recording the same xG value as Kyle Wootton with both of them on the score sheet.
Notts coming out on top in both halves and with an expected points (xPTS) value of 1.810 suggesting they were just about good value for the 2-1 win.
National League goal scorers includes cup games, penalties and own goals.
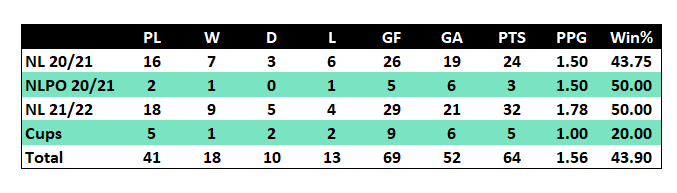
Ian Burchnall's record updated after 41 games.
As it stands a win percentage of 43.9% puts IB 11th in the all time Notts managers table. A PPG of 1.56 is currently the 9th best recorded in the all time Notts manager table.
A chance to recharge the batteries now before we are back at the lane with relegated Southend United the visitors. Keep your eyes peeled for the preview.
Thanks for reading.
COYP!
Richard