Those of you that are regular readers of these pages will know that xG (expected goals) now forms an integral part of my pre and post match analysis.
It's fair to say it has been a bit of a statistical nightmare for me given Notts' current position in the pyramid and the lack of available data accessible to us at our level. That said I'm happy I have now found a data source that accurately depicts xG and other 'expected' scenario's such as expected goals against (xGA) and expected points (xPTS) that will allow me to provide a more insightful analytical experience.
So what exactly is xG and how does it work?
We've all applied a manual version of xG at some point or other when watching a game. How often have we said things like "We really should have won that", "A draw would have been a fair result", "Nine times out of ten he would have scored that" or "We were terrible today but got away with it".
These are non quantified declarations of what happened in a game compared to what we feel should have, or expected to happen.
xG = Expected Goals. It is the amount of goals on average that a team or player would be expected to score given the chances they had. It is simply a way to get a pretty accurate summary of a teams’ performance, beyond the actual result.
Most xG models adopt a number of common factors to calculate the xG rating of an attempt on goal.
In its simplest form a value can be given to an individual shot based on the likelyhood of a goal being scored. For example the average shot to goal conversion is 1 goal in 10 shots. Based on this you could apply a simple value of 0.10 to every shot on goal. This is an easy way of charting how a team has performed in a game compared to potential expected goals.
Additionally when these shots are plotted against minutes in a game you can determine other factors such as segments of the game when a team was more threatening or if a game was particularly one sided.
The following chart provides an example of how this simple xG model might look.
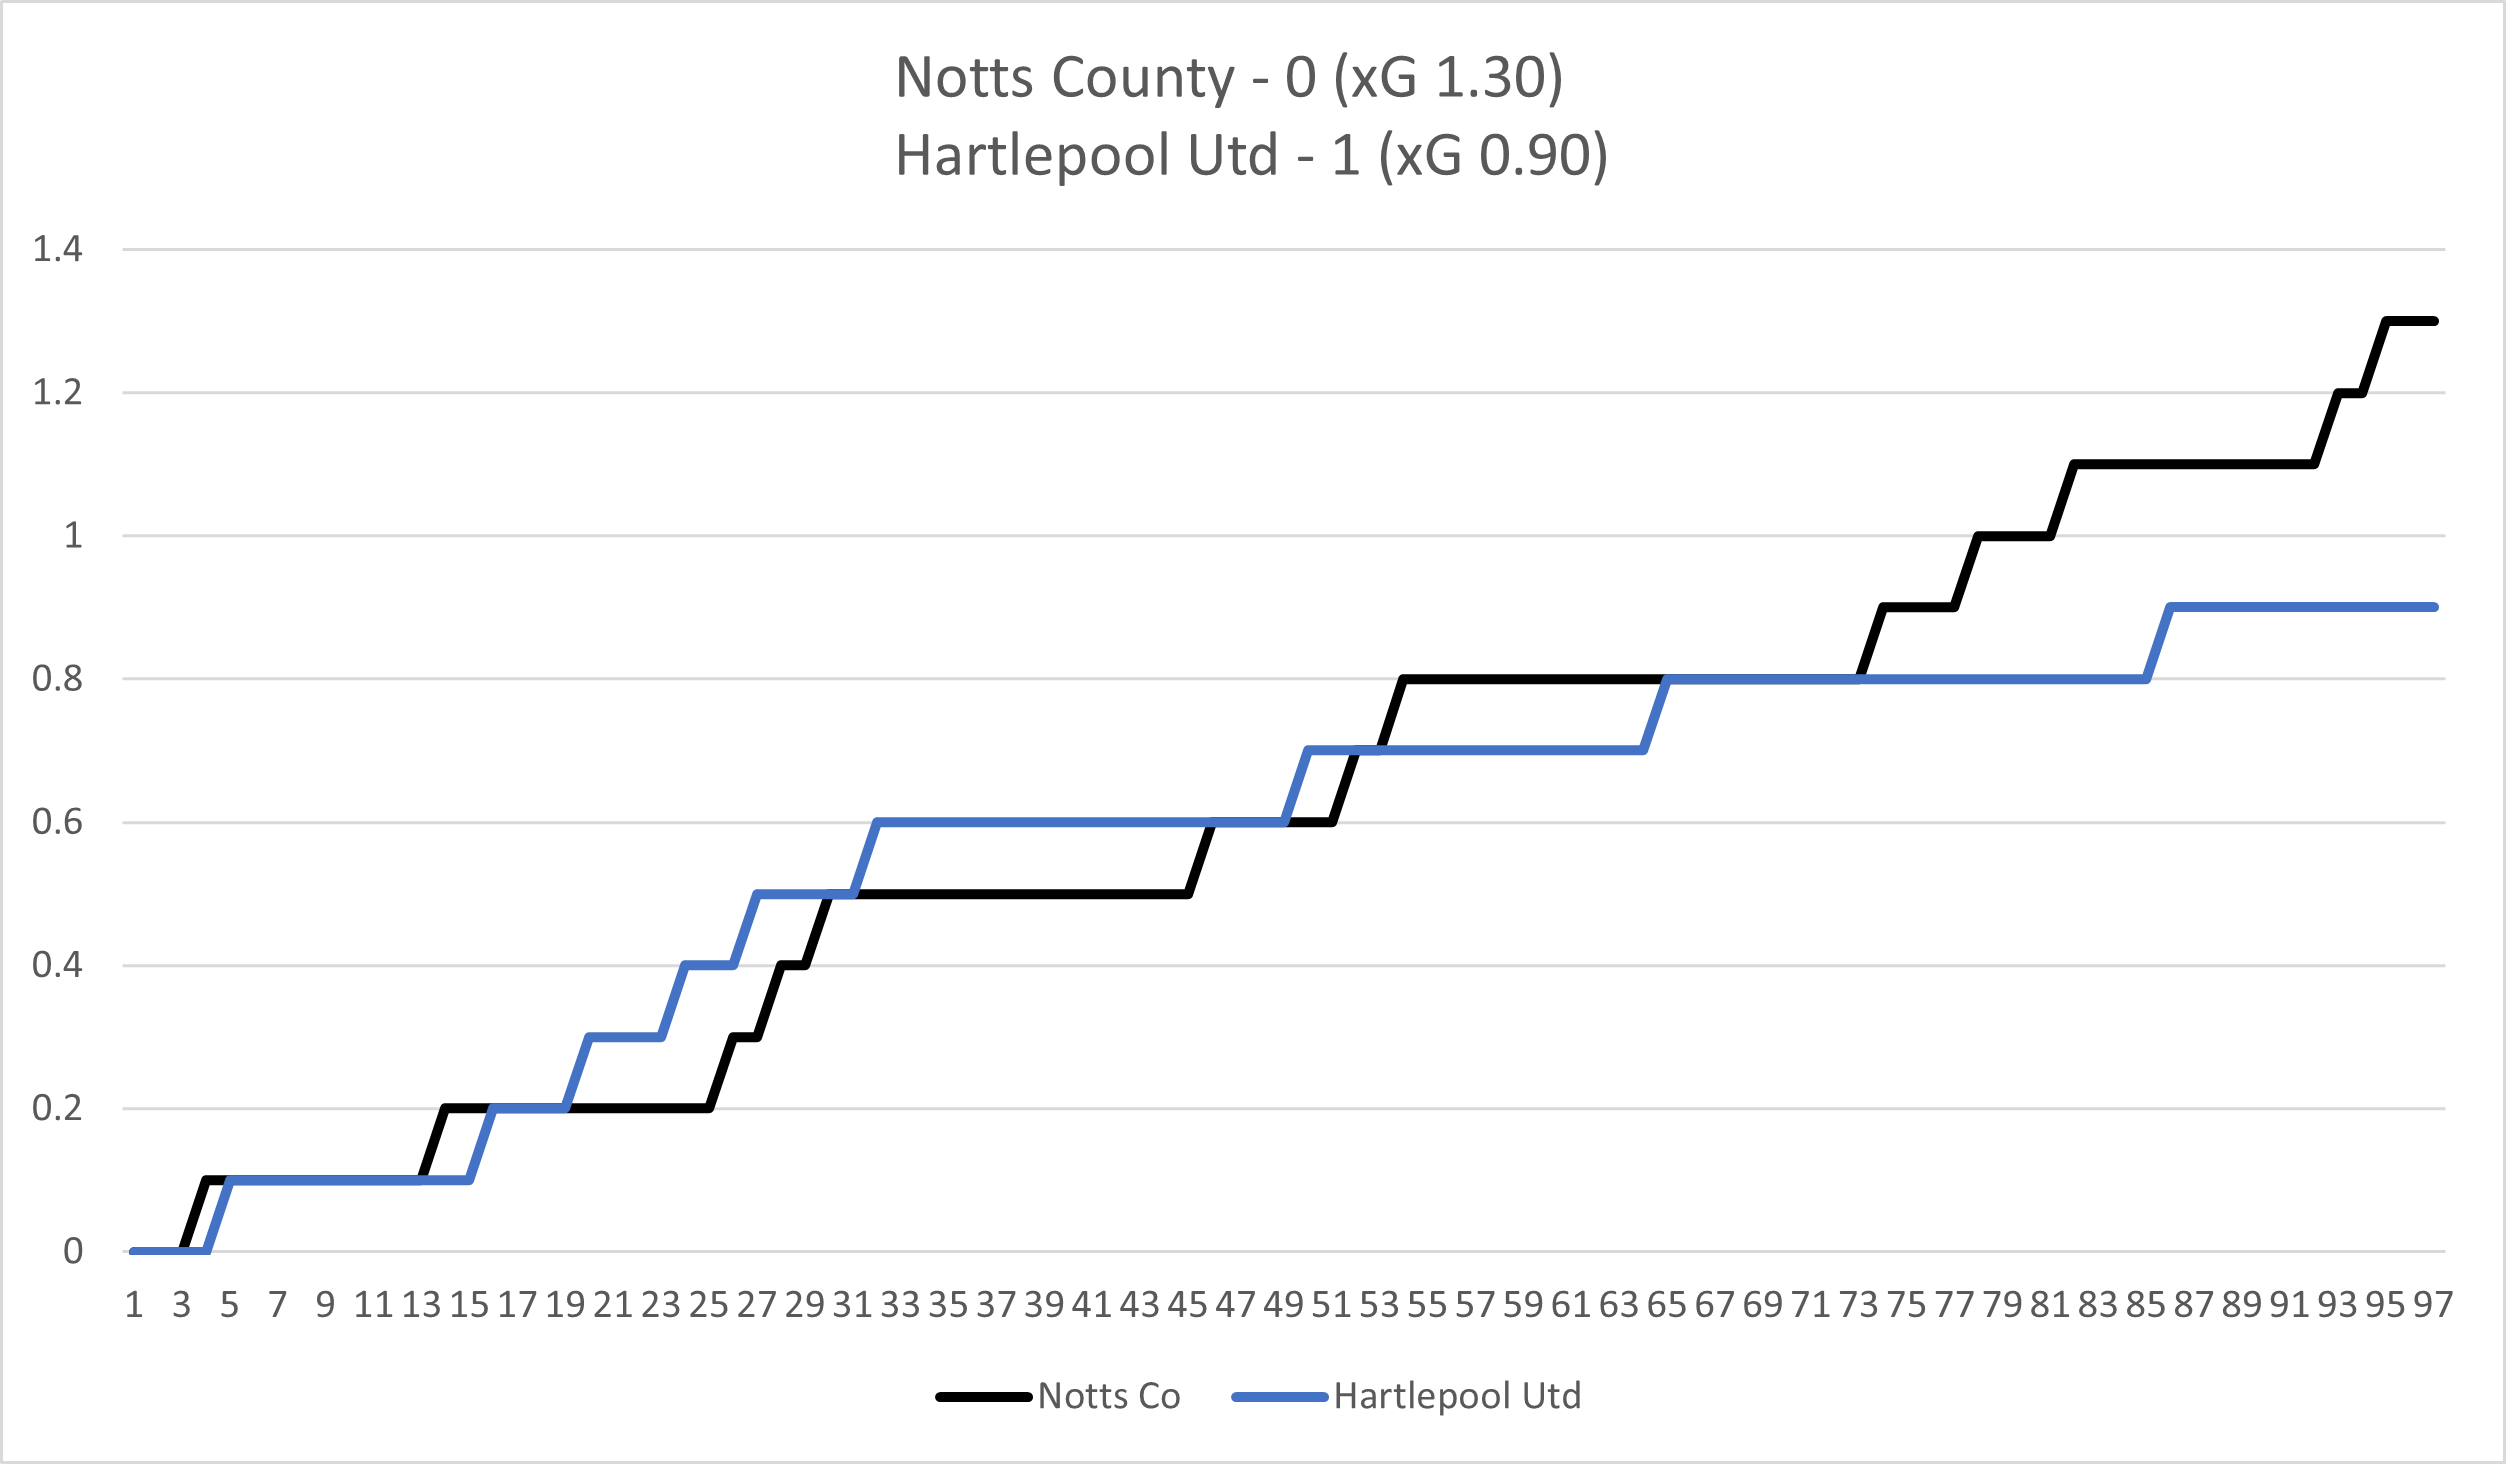
Using the above model it would suggest that although it was a pretty even game Notts had the most shots and should consider themselves unlucky to lose.
As a visual it also shows us that Notts were the busier team in attack during the last 30 minutes or so, however, that's where the analysis really stops and what it essentially tells us is that Notts had 13 attempts on goal compared to 9 attempts from Hartlepool and that the latter managed to convert one of their chances.
In order to assess a teams performance beyond the result we need a model that takes a number of factors into consideration which might include;
shot location
shot type
assist type
defence pressure
goalkeeper position
This is fine if we are assuming like for like chances so we now also need to consider other factors;
a shot from the centre of goal will have a higher rating than one from an acute angle.
an attempt with the foot is better than the head.
an assist pulled back from the byline will generally be rated better than, say, a long floated ball from an angle.
a shot where a player has space and time will be rated better than one with close defensive pressure on him.
a header with the keeper in a standard position will be rated less than if the keeper has flapped at a cross and is in no mans land.
It's now important to look at a game as a series of chances and whether or not these chances result in a goal attempt. Using the chances created we can start to piece together an expected goals for the match.
In addition to this we can then also simulate this to determine how many times a team might win/lose/draw with these xG numbers and what their average expected points (xPTS) might be.
In short, xG is doing nothing different to what any of us do whilst watching a match. Instinctively we know the difference between a good chance and a difficult chance and in most cases, if asked, could probably put a value on it from 0-10. This is because we have seen thousands of chances over the years giving us an internal barometer that provides us with an instinctive measurement of chance difficulty.
Using the game versus Hartlepool in the first example let's see what the xG looks like if we now use the chance weighted expected goals model.
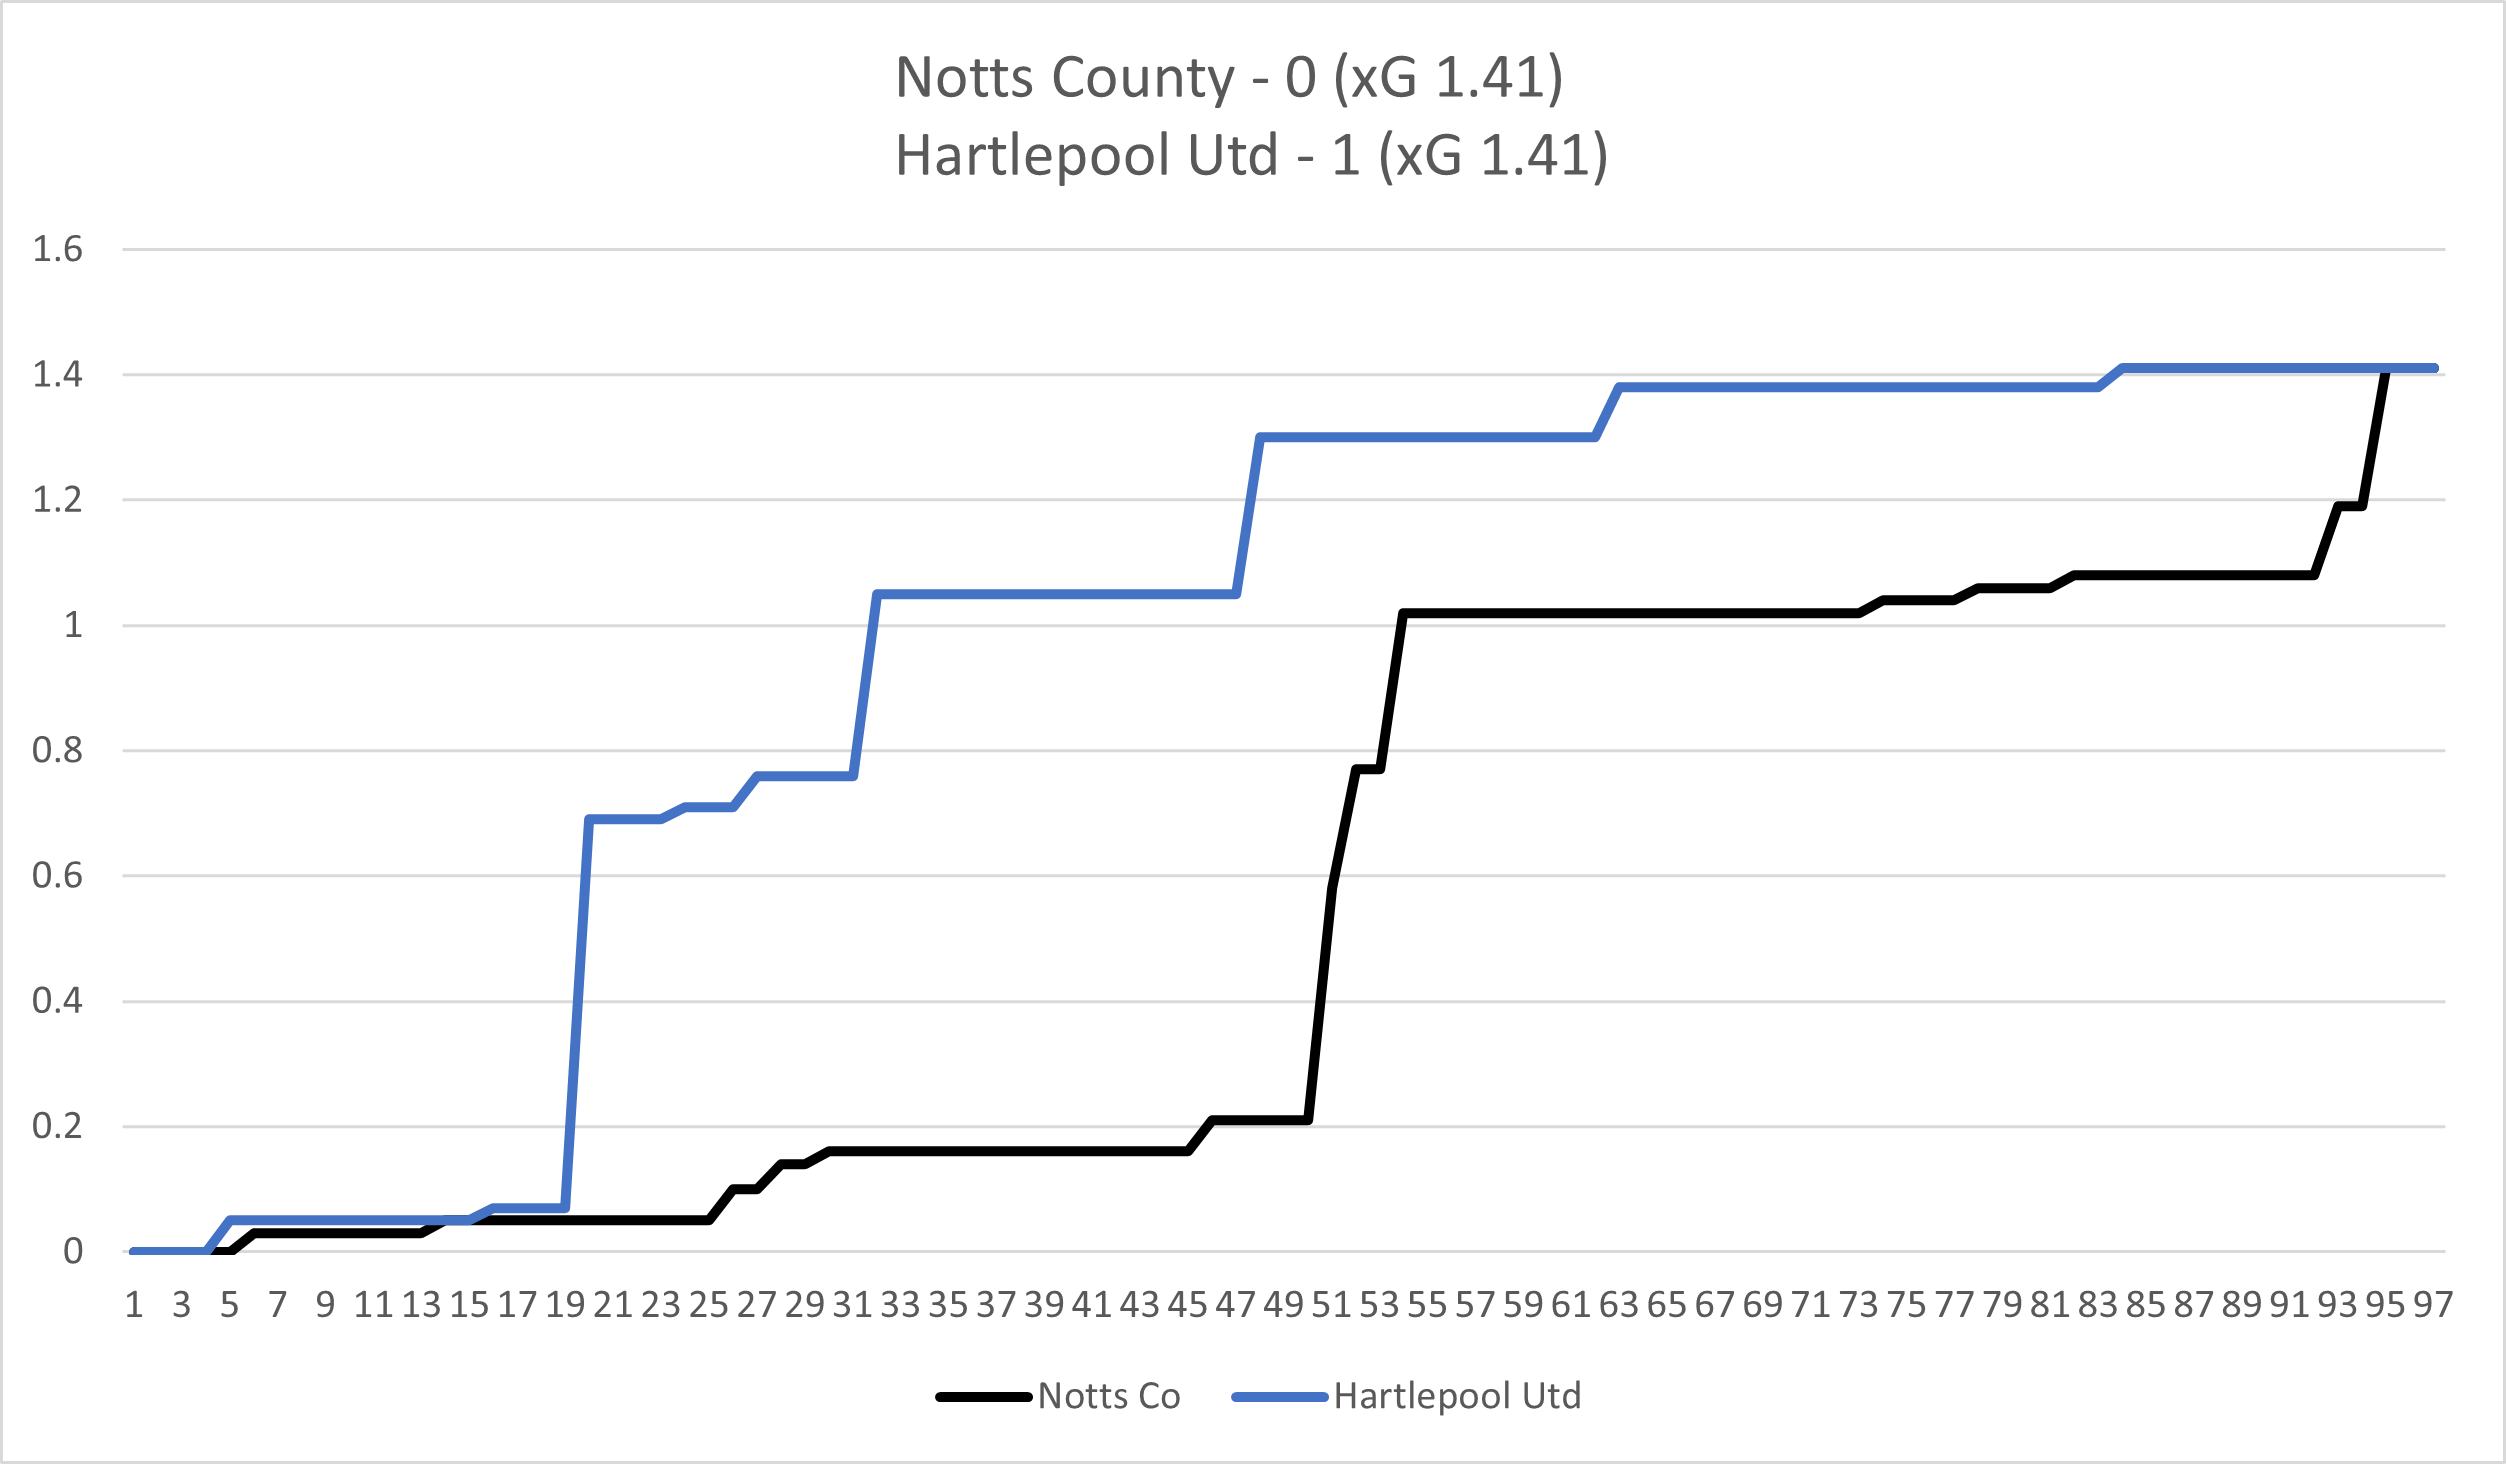
The first thing we notice is that despite Notts having more attempts the actual xG rating for both teams is identical. This is because in general there were chances that Hartlepool had that were deemed easier than many of those for Notts.
It is also clear that it was essentially a game of two halves with Hartlepool in the ascendency in the first half and Notts more in control of the second half, which is further confirmed in the key xG match stats below;
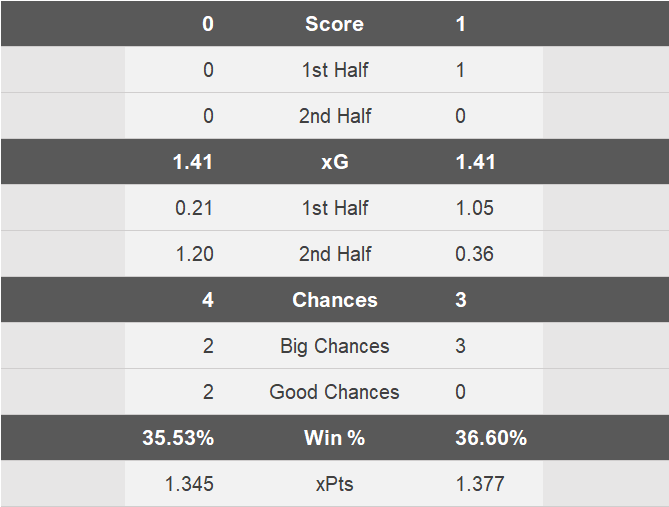
The xG ratings using this model clearly suggest that overall a draw would have been a fair result which is further endorsed by the xPTS and I'm sure those who watched the game would probably agree.
How the xG rating is calculated per chance
The providers for the data I now use for xG physically watch every shot which allows them to accurately record defensive pressure, goalkeeper position, shot difficulty (overhead kicks, backheels etc) and things of that nature which are difficult for a basic xG model to account for.
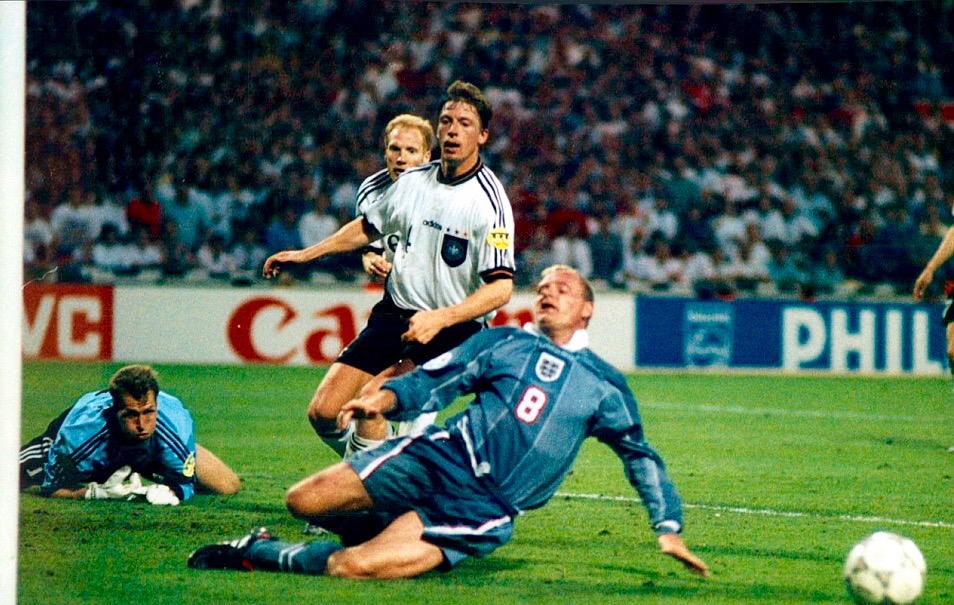
Additionally, for an extra layer of accuracy, edited highlights are watched to ensure any big chances that did not result in a shot have not been missed by the model (think Gazza Euro 96 semi-final v Germany, stretching for the ball but an inch away).
A weighted chance rating is then applied after all conditions have been considered with a very difficult chance probably only having a rating of 0.02 xG and a very easy chance likely to have a rating in excess of 0.70 xG.
The ratings for the chances in the Notts v Pools game are shown here as an example;
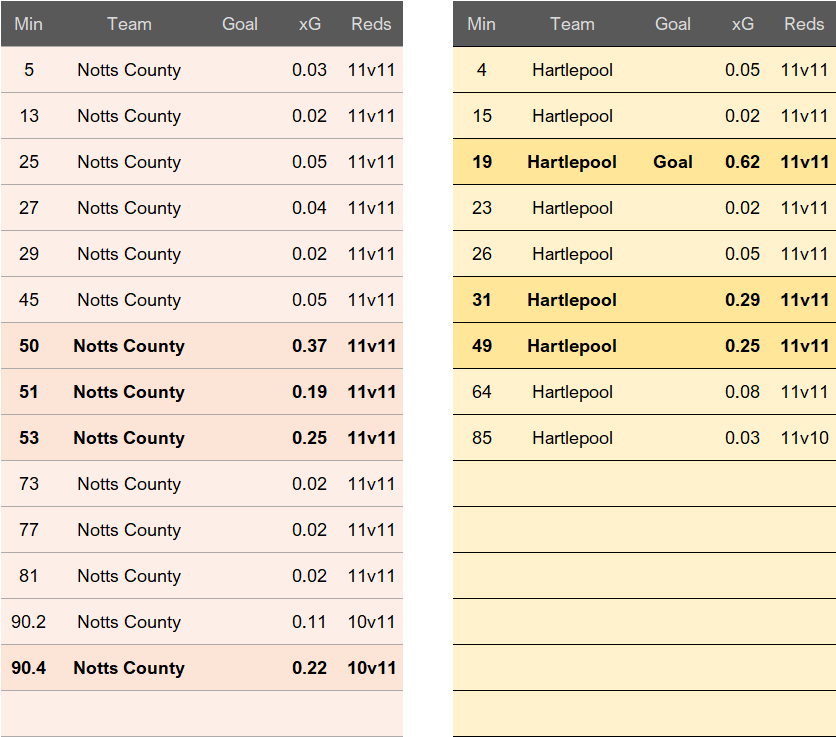
The table above clearly shows that despite Notts having more chances the likelihood of scoring in most cases was lower than the chances Hartlepool had.
Penalties are not treated as a chance as an innocuous handball in a non-dangerous edge of the box situation is given the same xG rating as a penalty given for a player going round the keeper and being hauled down before the player taps it in, therfore a rating is given to the chance as if the foul never happened and then the penalty xG added afterwards.
Expected Points (xPTS)
Expected points can be used to identify a team's expected points based on their performance compared to actual points gained.
In the National League Torquay is a prime example and whilst there is no way you can dispute they have had a phenomenal start to the season their actual points compared to expected points does raise an eyebrow.
After 16 games they had 38 points and a PPG average of 2.380, however, their xPTS for the same period has them at 25.98 and a PPG of 1.618. This suggests that they have actually over performed by more than 12 points.
Having looked closer at Torquay's results there have been some that fully justify their current position, but there are at least 3 games where they somehow managed to find a winning goal in added time plus a couple more where late goals in the last few minutes of a game won them the 3 points.
There are a few games they have won where their opponents squandered big chances and their shots to goal ratio is well above average with their shots to goals against ratio well below average suggesting their over performance might not be sustainable. In fact this has been endorsed by their recent form which has seen them drop 8 points in the last 6 games.
Ultimately xG provides a pretty accurate summary of how a team is performing or how a game went. There will obviously be occasions when individual shots are not rated accurately. Additionally things like red cards, penalties and game state can also produce misleading xG numbers in an individual game and it will always have its blind spots, Burnley for a couple of seasons in the Premier League wildly outperformed their xG. Whether it was prolonged luck or some kind of Sean Dyche magic is still up for debate to this day.
It's important to accept that xG isn't and never will be perfect, but what it is is a tool that helps you to understand a team and its performance a little better and get the same gist for any other club in the league.
That is all xG is. It is simply a way to give a numerical answer to the question “how did they play?” rather than just who won and who lost. A commentator might call a 30 yarder hitting the back of the net “a worldie” . . . we call it a “0.01xG long shot” but we are both saying the same thing. The xG way just lets us look at multiple chances and gives us numerical values to contrast and compare with.
Richard
Data and stats courtesy xGStats.com