For one final time this season I wanted to try and drill down on some of the stats for both Notts and Harrogate to see if there is any way we can try and predict a result for what has to be the tightest play off final in any league for a long time.
In order to do this I have researched a number of metrics around goals and goal attempts to try and determine some kind of expected goals (xG) formula as well as attacking and defending efficiencies.
I have then looked at these metrics for the whole season (league only) and last 6 including the play off semi finals to see if that provides any further insight.
Finally I have thrown in the fact that Harrogate have spent the season playing on a plastic pitch at the GNC which would potentially have given them an advantage and compared this to their results playing on grass.
The results will hopefully be a score prediction of sorts, just don't hold me to it.
Firstly lets look at goal attempts taken and goal attempts faced.
For the league season Notts averaged 10.79 attempts on goal per game and faced 10.21 attempts per game from the opposition.
Harrogate were a little bit busier than Notts at both ends of the pitch averaging 12.86 attempts on goal and facing an average of 11.65 attempts per game from their opposition.
If we do the same exercise again for the last 6 including the play off semi finals it’s very evident that both clubs were actually creating more chances on recent form than their season averages. However, the average number of attempts faced by Harrogate only dropped very slightly whereas Notts had actually sizeably reduced the number of attempts faced by the opposition.
Average goal attempts last 6 by Notts is 13.17 and for Harrogate it is 15.67.
Average goal attempts faced last 6 by Notts dropped to just 8.83 whereas Harrogate’s average came in at 10.83.
Next we have to look at goals scored and conceded per game. Notts averaged 1.62 goals per game for the season conceding an average of 0.97 per game.
By contrast Harrogate averaged a very similar 1.63 goals per game but conceded a slightly higher 1.16 goals per game.
Now if we take recent form and the last 6 as above with goal attempts the numbers are frustratingly close again. Both clubs have averaged 2.17 goals per game for the last 6, however, Harrogate have conceded an average of 0.83 per game and Notts have done slightly better at 0.67 per game.
So to summarise on the above both clubs are pretty much level pegging on the attacking front, however Notts do seem to reduce the opposition to slightly fewer chances and concede less goals albeit the margins remain very small.
We now need to try and translate this into xG ratings. Unfortunately, without spending days and days analysing every goal attempt in every game for both clubs we cannot add a weighted probability to the calculation. With this in mind we can use a standard formula that is widely used based on the general consensus that there is a 10% probability of a goal being scored from a shot.
xG = 0.10 x shots/attempts
Using this formula we can calculate the following xG ratings for both clubs for both season and recent form.
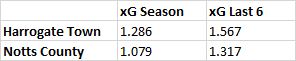
So based on the above figures Harrogate clearly appear to have the edge when it comes to expected goals.
Now using the same formula we can look at expected goals against (xGA).
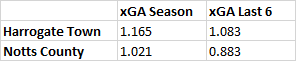
Taking xGA into consideration the pendulum now swings in Notts' favour.
Again the margins are extremely close but what can we deduce from this. Well to put it bluntly it's blatantly obvious this game has the potential to be a very tight and nervy encounter.
So what other stats related factors can we consider that might have a bearing on the game?
There is an argument that Harrogate have benefited this season from their artificial playing surface. If we decide to take this into consideration how much of a difference has this made?
Of the 38 league matches played, play off semi final included, just 7 of their 20 victories have come on grass and 6 out of 9 defeats have also been played out on grass.
If we were to make the same xG/xGA calculations based on playing surface then Harrogate’s figures don’t look too great so maybe this is one area where Notts might be able to take some advantage.
Ultimately it looks like it will all come down to the number and quality of chances generated or allowed to be created by each team. We know both teams can play expansive attacking football so the key to success will most likely be down to which team manages to restrain the others attacking creativity the most.
Based on recent form Notts are more likely to achieve this. Additionally options off the bench for Notts will provide a number of different strategies depending on how the game is playing out. I’m not sure Harrogate have that same strength and variety in depth within their smaller squad.
Prediction time: The stats have it pretty even and based on xG/xGA you would find it hard not to assume a score draw in 90 mins so my stats prediction will be . . .
Harrogate Town 1-1 Notts County
Yep, sorry to disappoint, but there is just no separating the two clubs from a stats perspective. Obviously as a Notts supporter you will be hoping that experience and a strong squad will be just enough to see the Magpies over the line. However, we should ignore Harrogate and their attacking threat at our peril.
Either way the last 12 months has been one hell of a roller coaster ride and whatever happens I think we can all agree we can look forward to a much better future at Meadow Lane.
COYP!